
Asset Summary
1 min readEdit
On this page⌄
About This Dashboard
The asset summary dashboard provides various metrics that provide a general synopsis of the health of your assets.
Asset Business Sensitivity vs Vulnerabilities
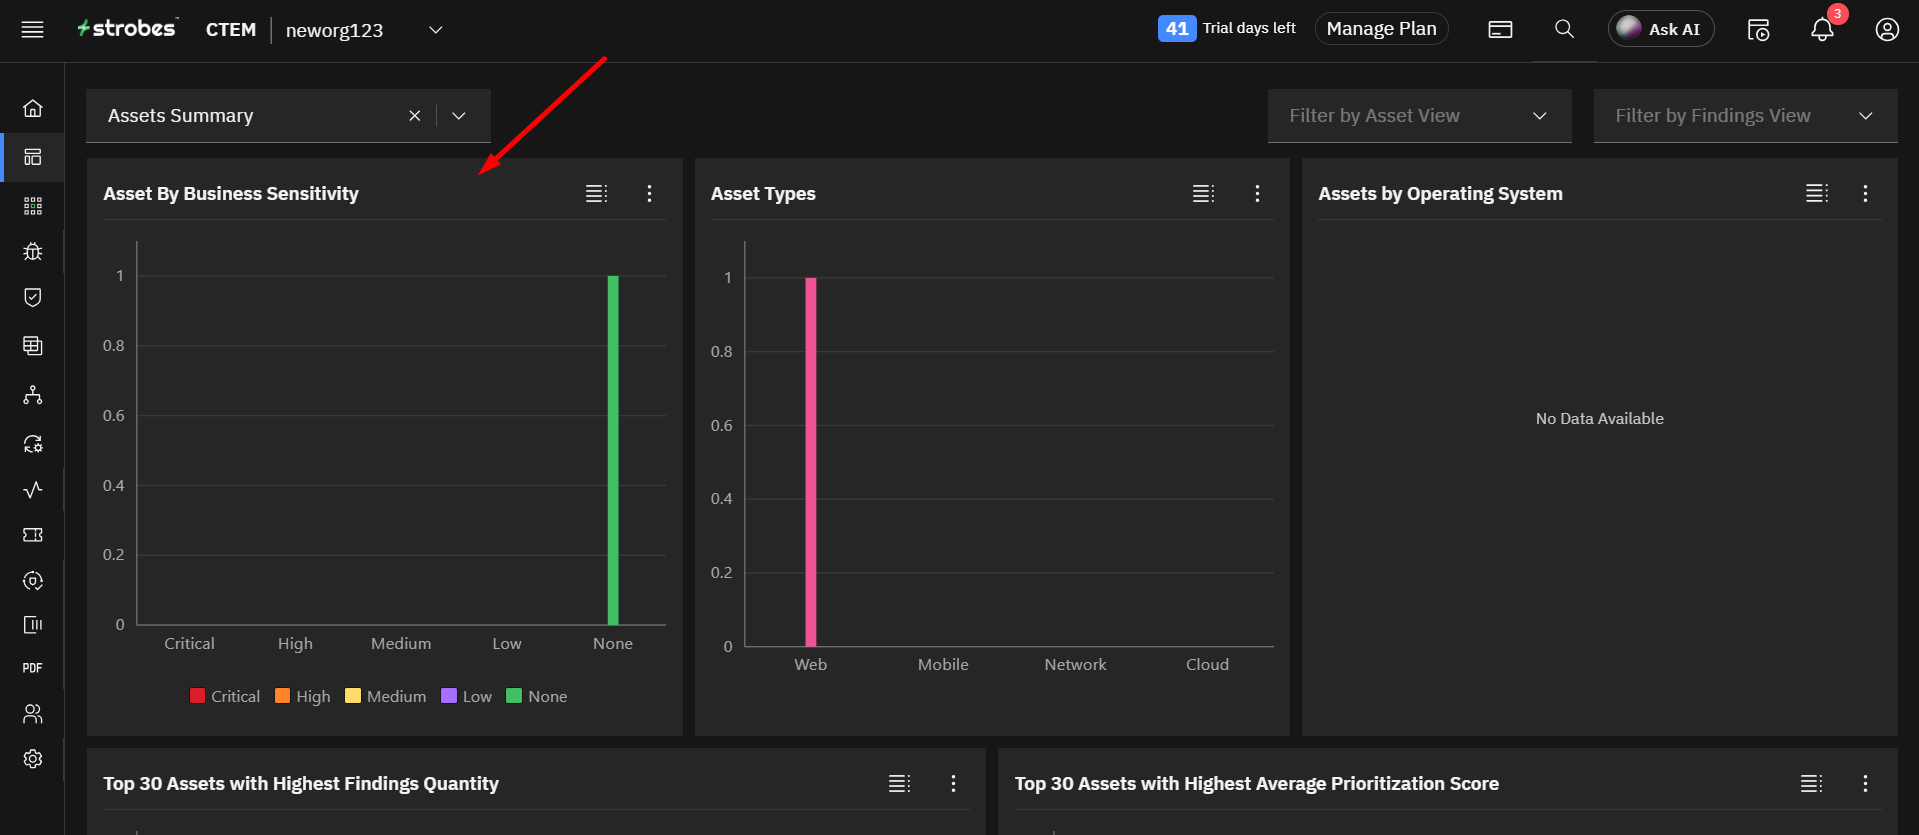
This chart provides you with the total count of vulnerabilities distributed based on Asset Business Sensitivity. To learn more about Asset Business Sensitivity, check the Resources section in this article.
Asset Types
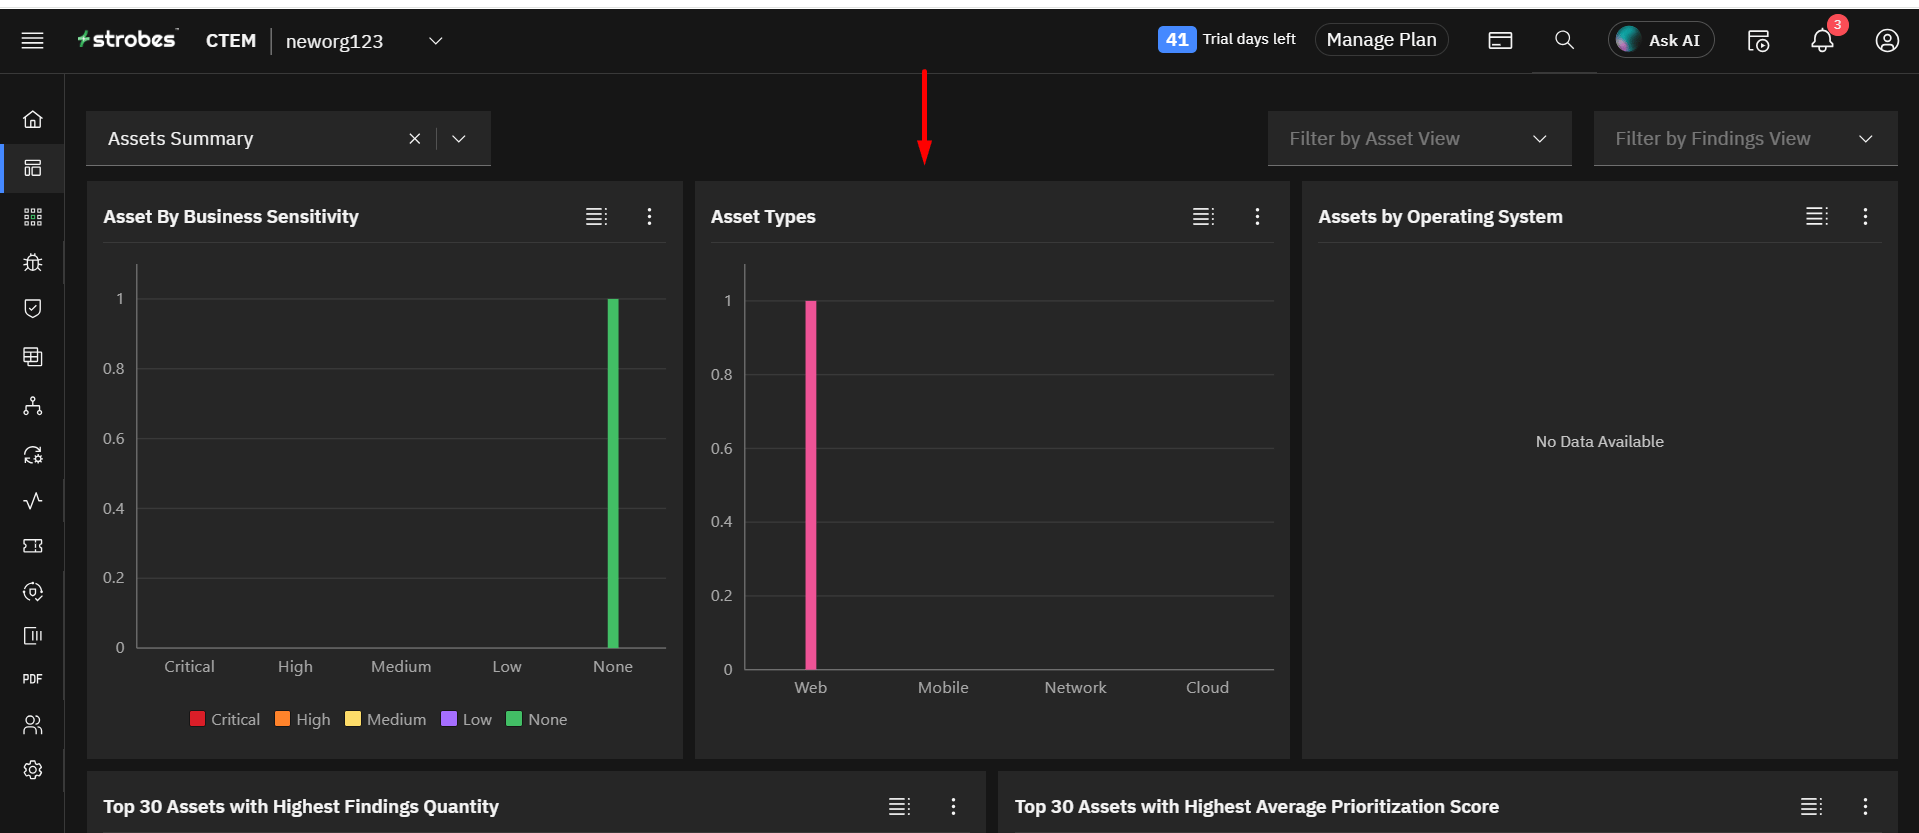
This chart distributes vulnerabilities across Asset Types.
Vulnerabilities by Operating System
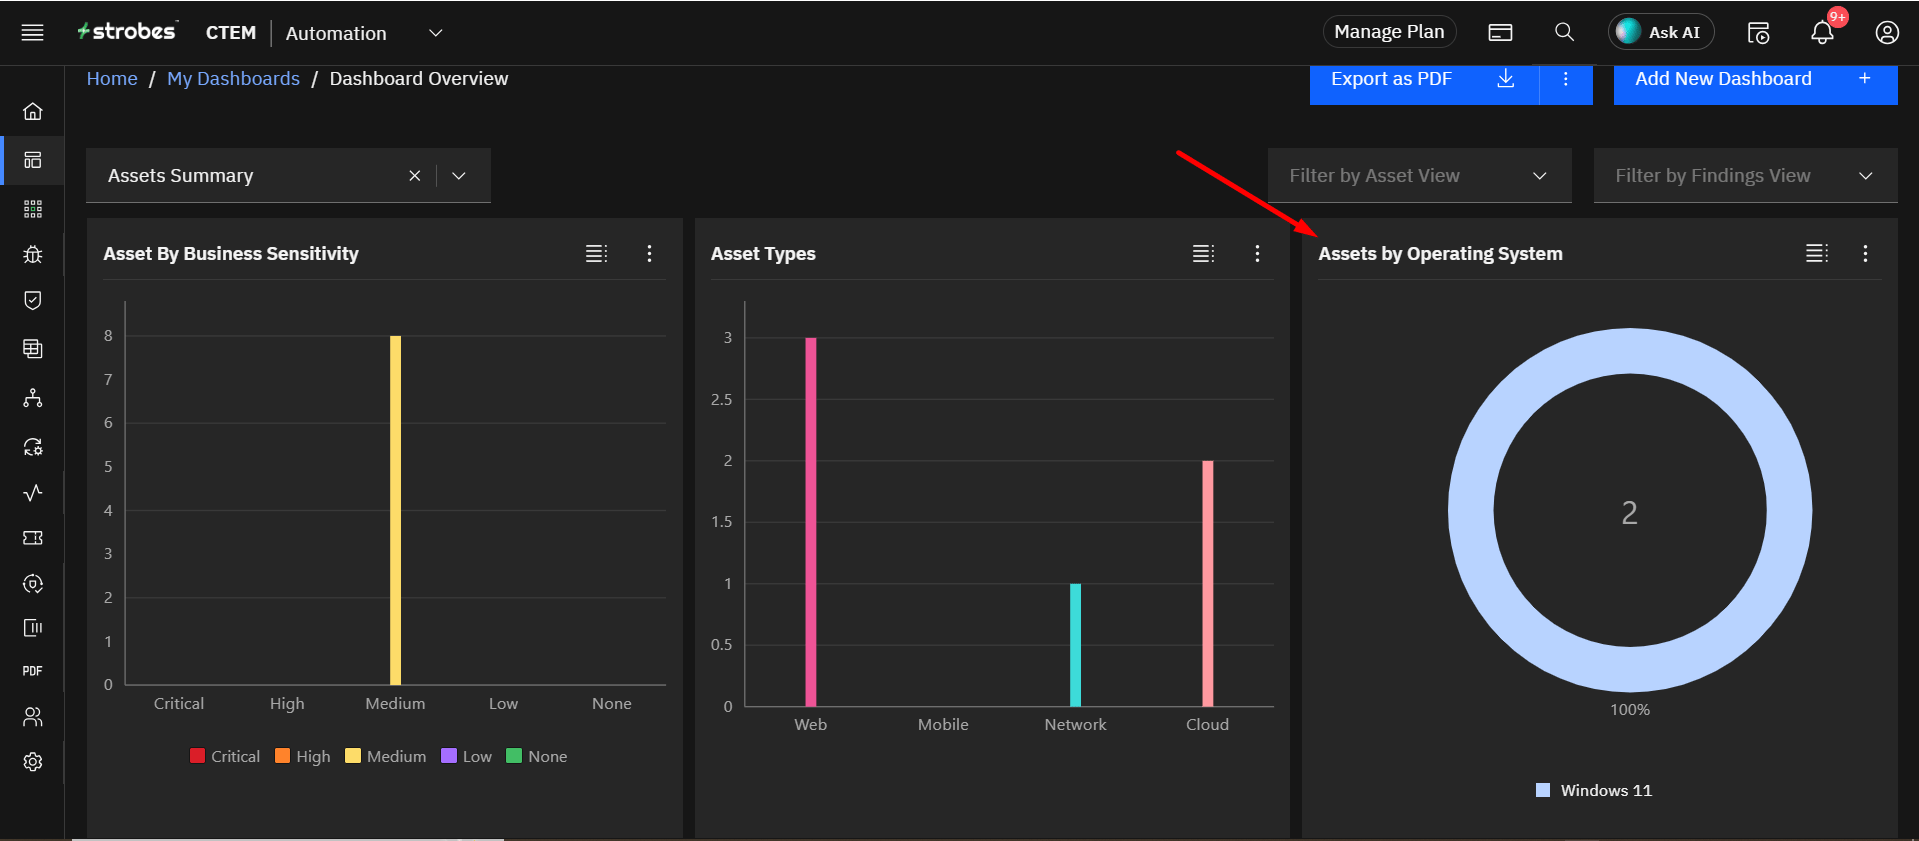
This chart distributes vulnerabilities across the operating systems of your digital assets.
Top 30 Assets with Highest Vulnerabilities Quantity
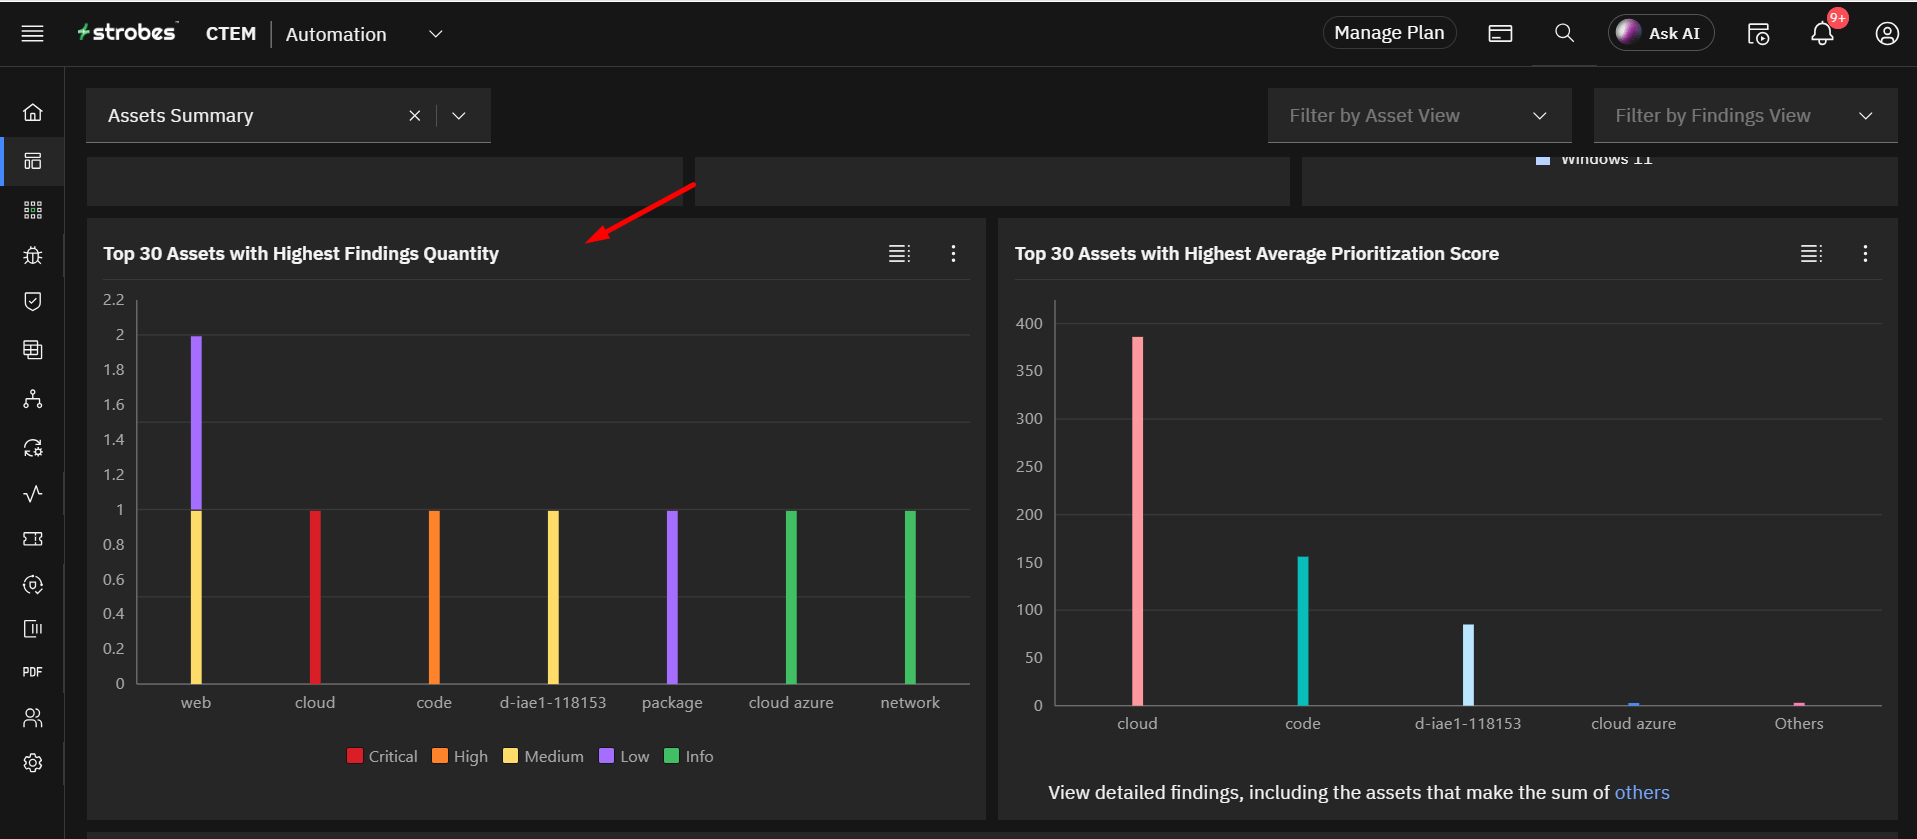
This chart presents your top 30 assets that carry the highest number of vulnerabilities distributed based on severity.
Top 30 Assets with Highest Average Prioritization Score
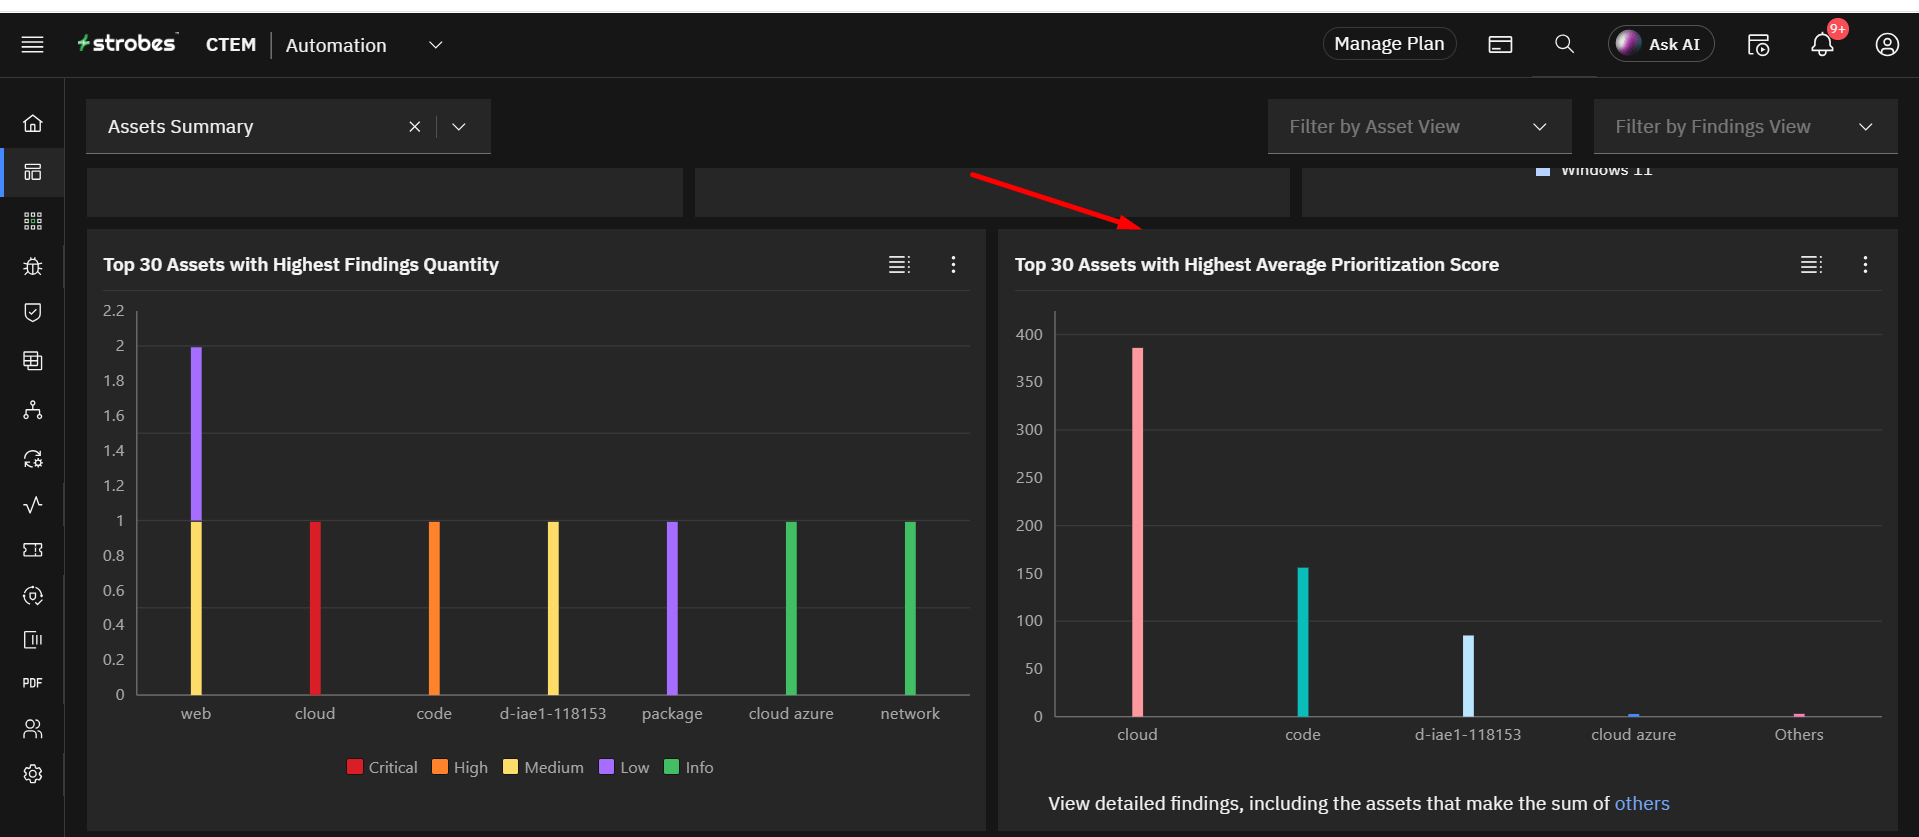
This chart presents your top 30 assets whose prioritization is taken average.
Top Performing Assets
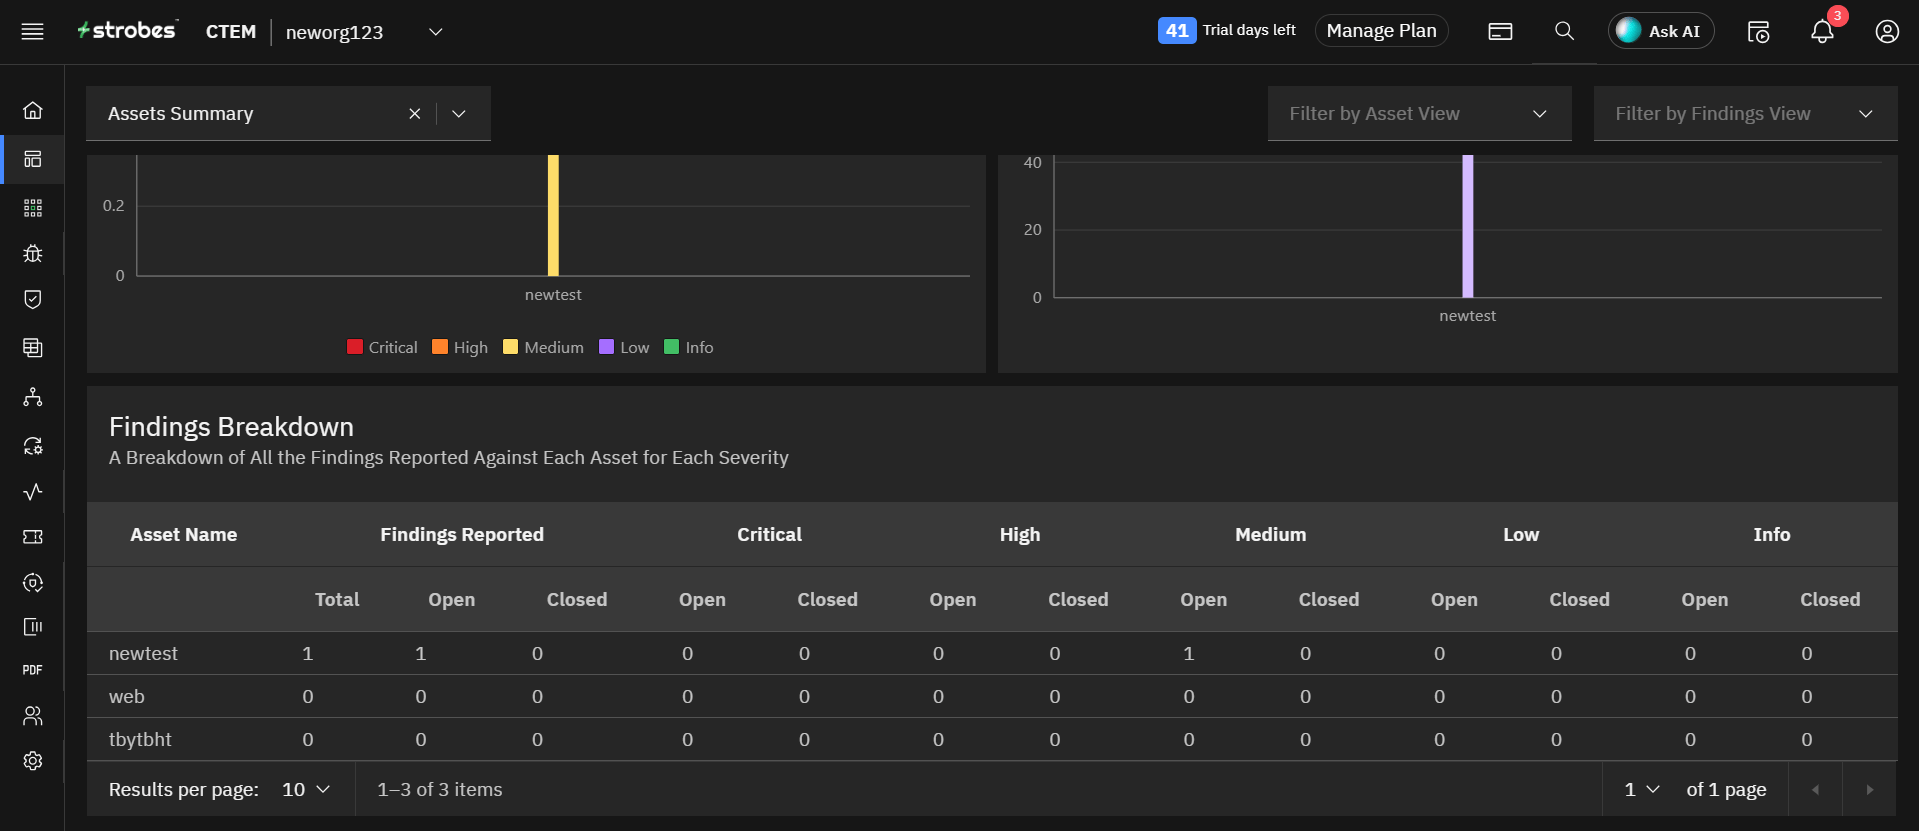
This table shows you which of your assets' risks has been improving. This is calculated based on the assets' current risk score, its highest risk score, the total number of vulnerabilities, open vulnerabilities, and SLA statuses.
Customization
If you would like to have your own KRI in this dashboard, please contact your customer success manager.
More in Assets
Was this page helpful?