
Creating and Managing Dashboards
Create custom Strobes dashboards: build widgets from scratch, choose the data they pull, and arrange them with the drag-and-drop dashboard builder.
4 min readEdit
On this page⌄
- Overview
- Two Ways to Create a Dashboard (Custom)
- Path 1 — Using the Dashboards Page
- I. Opening the Dashboards Page
- II. Click on "Add New Dashboard" to create a New Custom Dashboard.
- III. Adding a Widget
- Path 2 — Using Settings > Dashboards (Full Control)
- The Dashboards Tab
- Creating a Dashboard from Settings
- The Dashboard Builder
- Follow the step III from the Path 1 to add Widgets.
- Tips
Overview
Strobes includes a library of pre-built dashboard templates that visualize your security data across prioritization, risk, pentesting, attack surface, patch management, threat intelligence, and more. You can open any template immediately, filter it by asset or findings view, and export it in several formats.
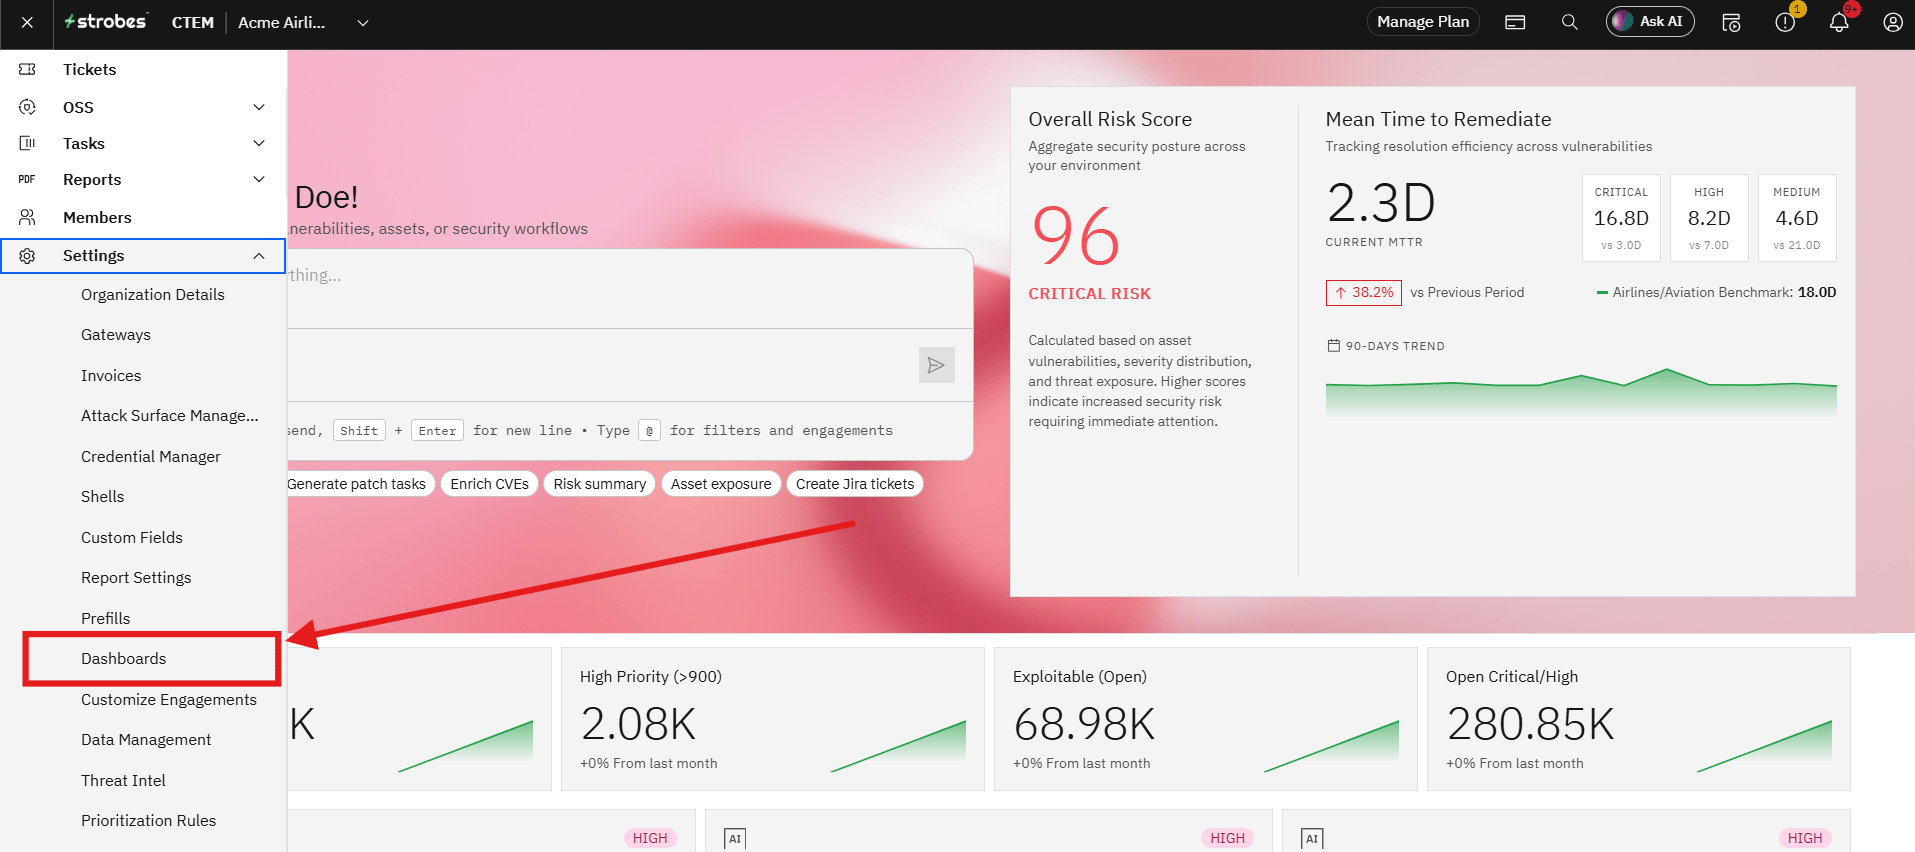
When you need more control use Settings > Dashboards. This path lets you create widgets from scratch, configure exactly which data they pull, and assemble them into custom dashboards with a drag-and-drop builder.
Two Ways to Create a Dashboard (Custom)
Path | Best for |
|---|---|
Dashboards | Opening and using default templates; quick creation and filtering. |
Settings > Dashboards | Building custom dashboards with full control over data, widgets, and layout |
Path 1 — Using the Dashboards Page
I. Opening the Dashboards Page
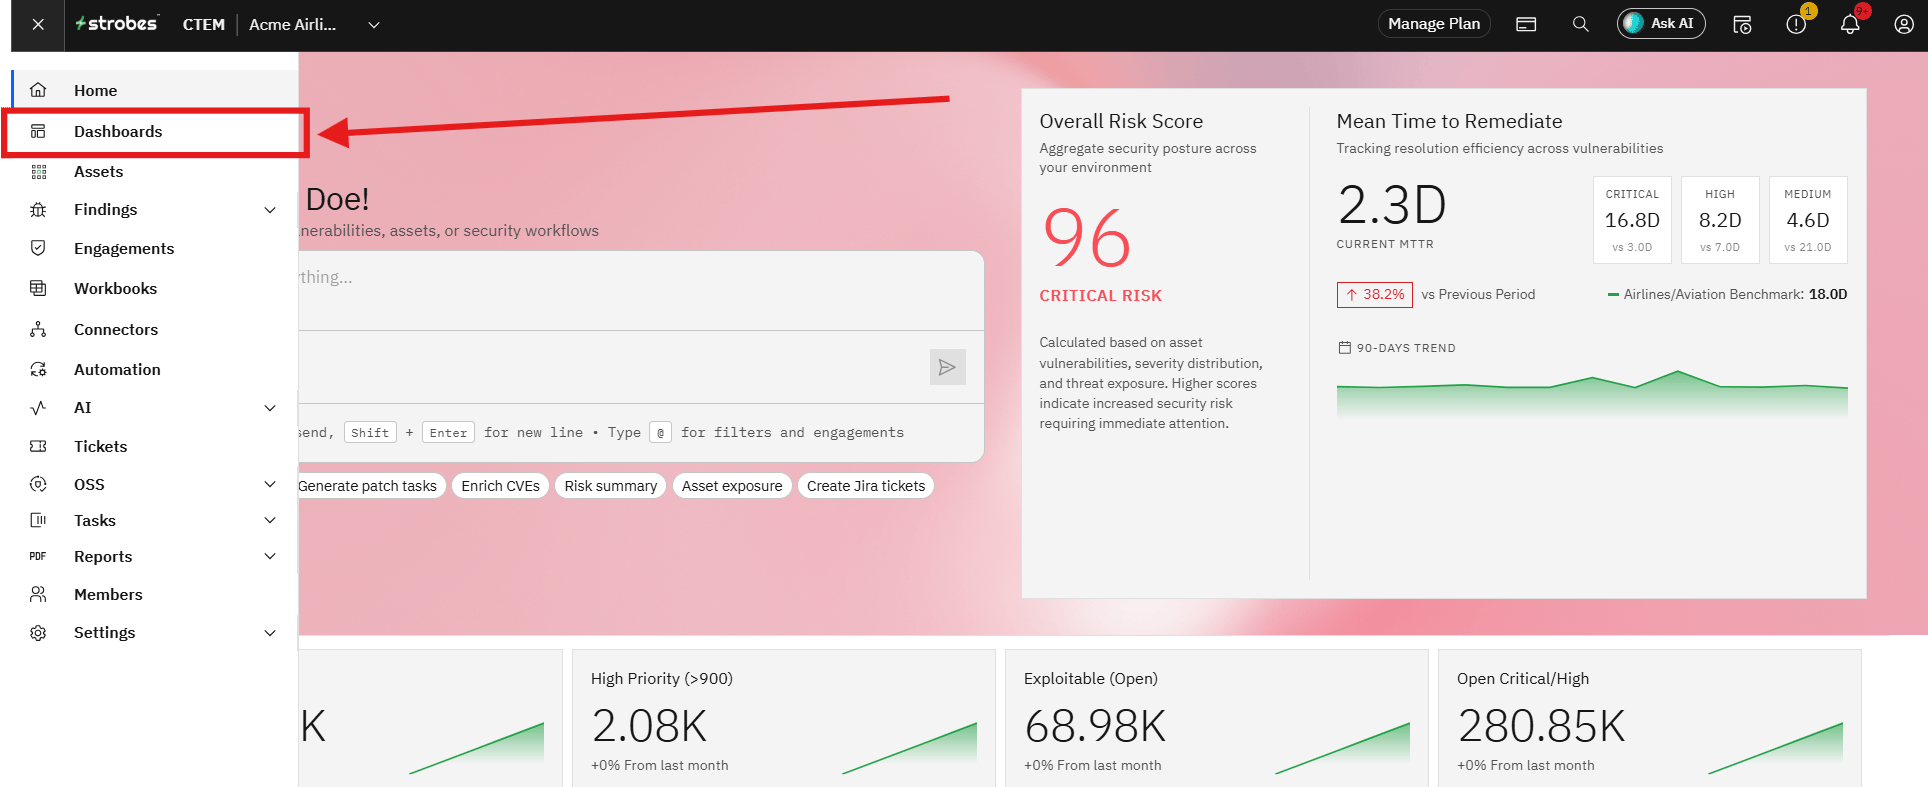
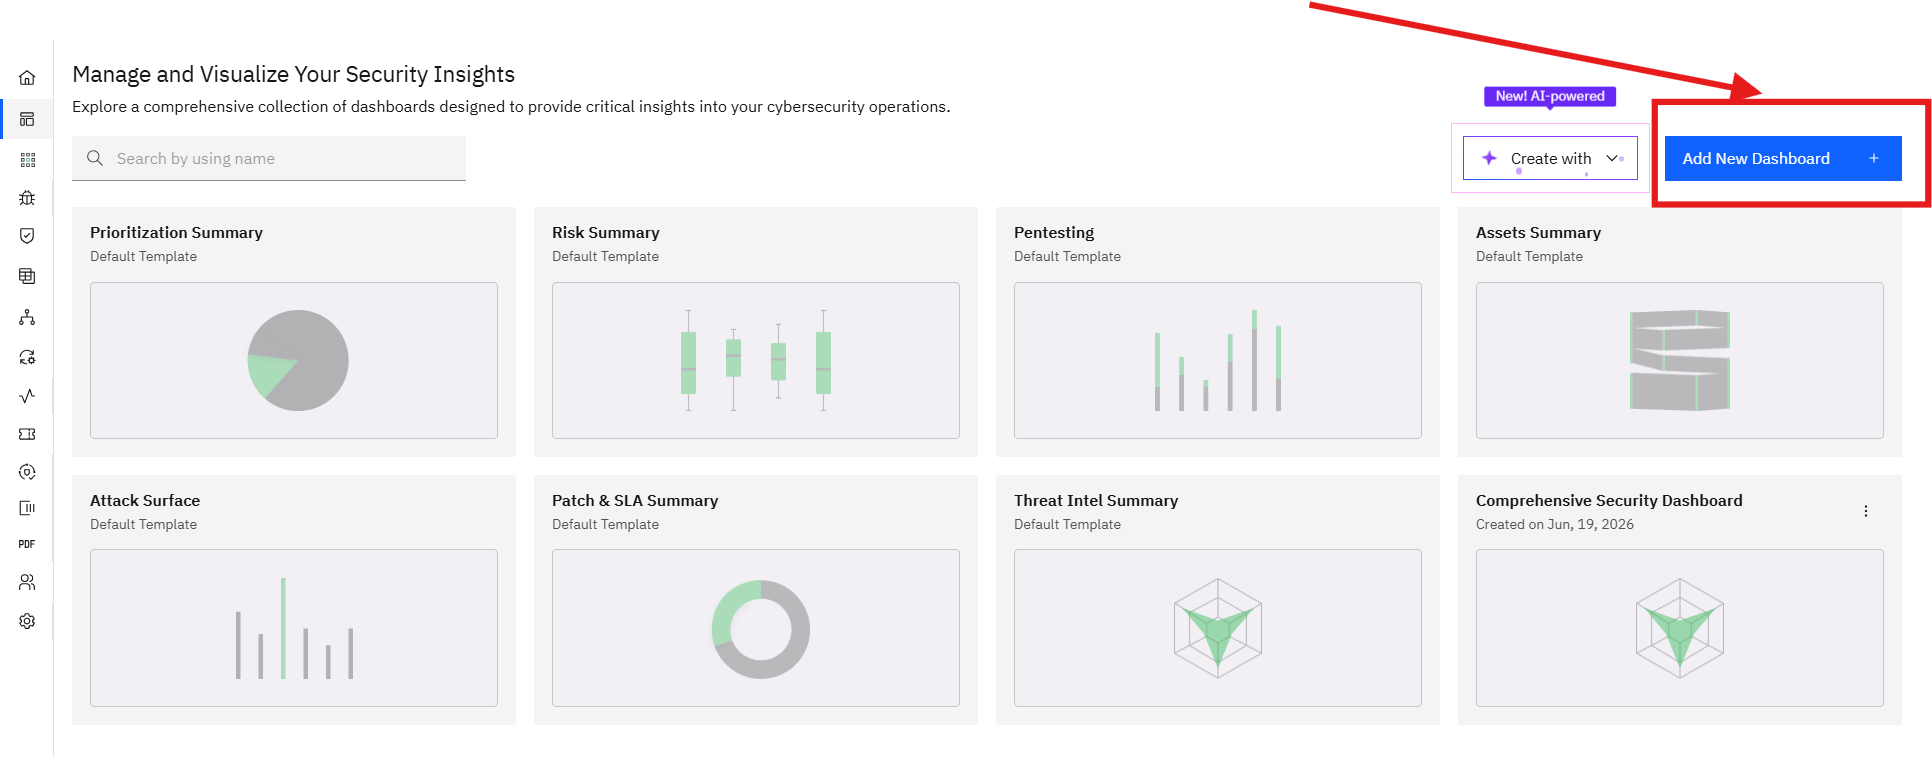
Click the Dashboards icon in the left sidebar. The page is titled Manage and Visualize Your Security Insights and shows all available dashboards as a card grid.
II. Click on "Add New Dashboard" to create a New Custom Dashboard.
Below represents how the Dashboard Creation page will look.
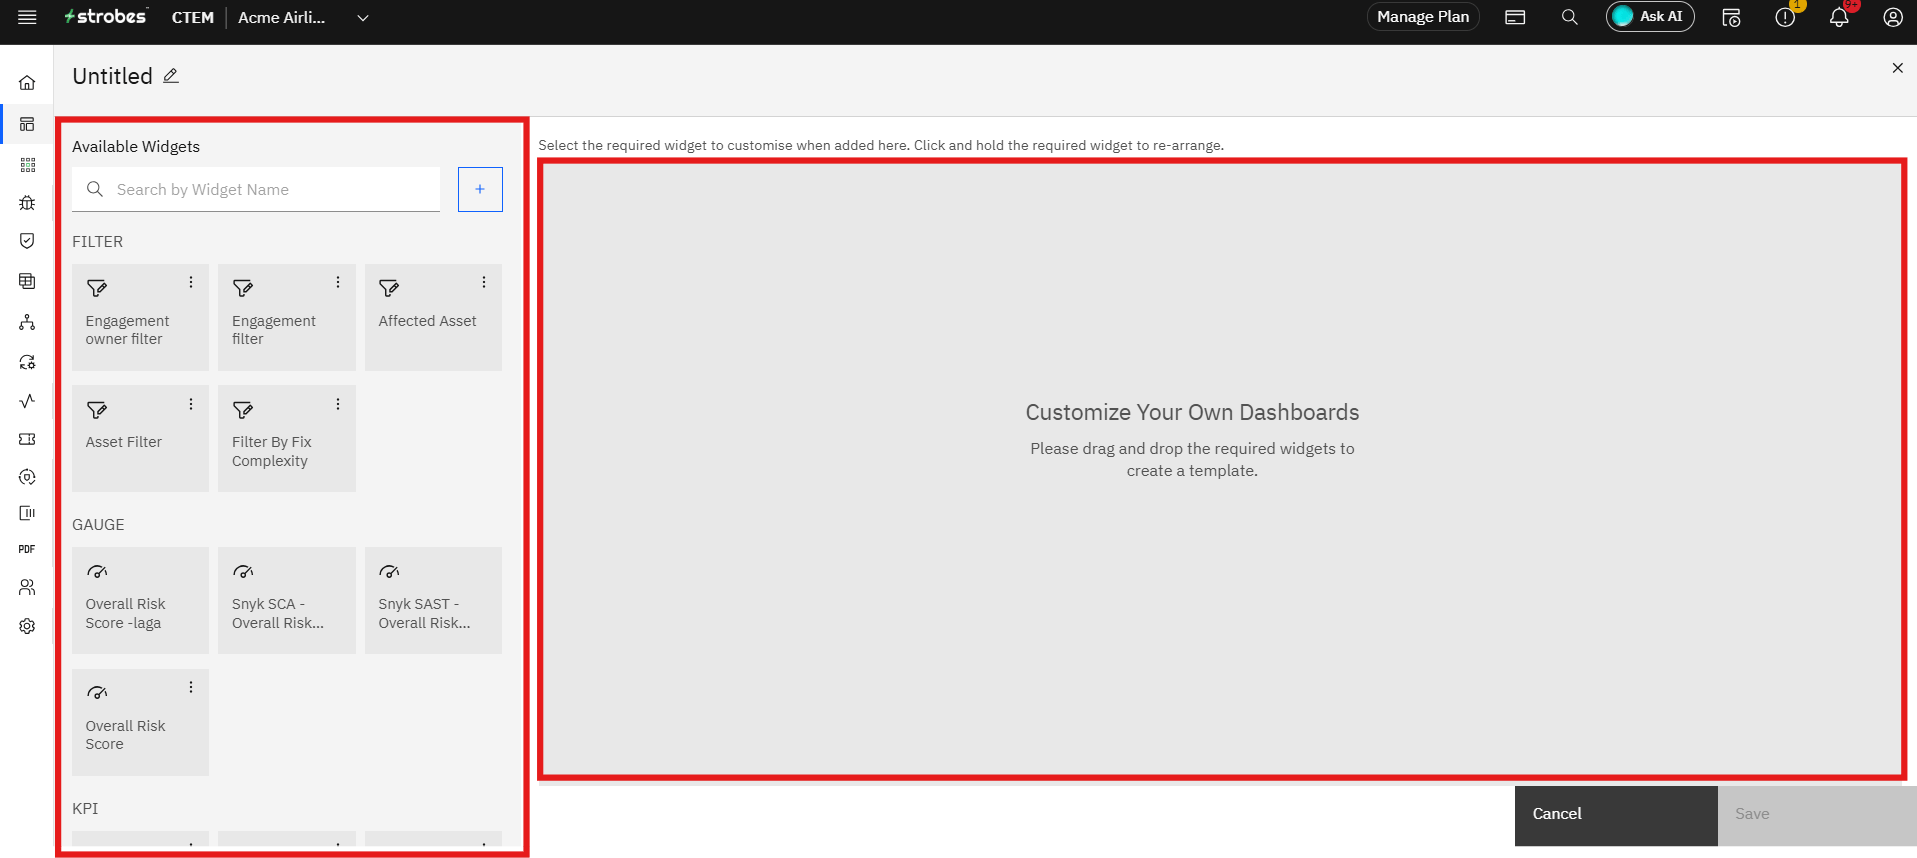
Left Panel | Shows all the availabe widgets that can be added to the dashboard. |
|---|---|
Right Space | This is a glimpse of how your Dashboard will look once you click Save. |
III. Adding a Widget
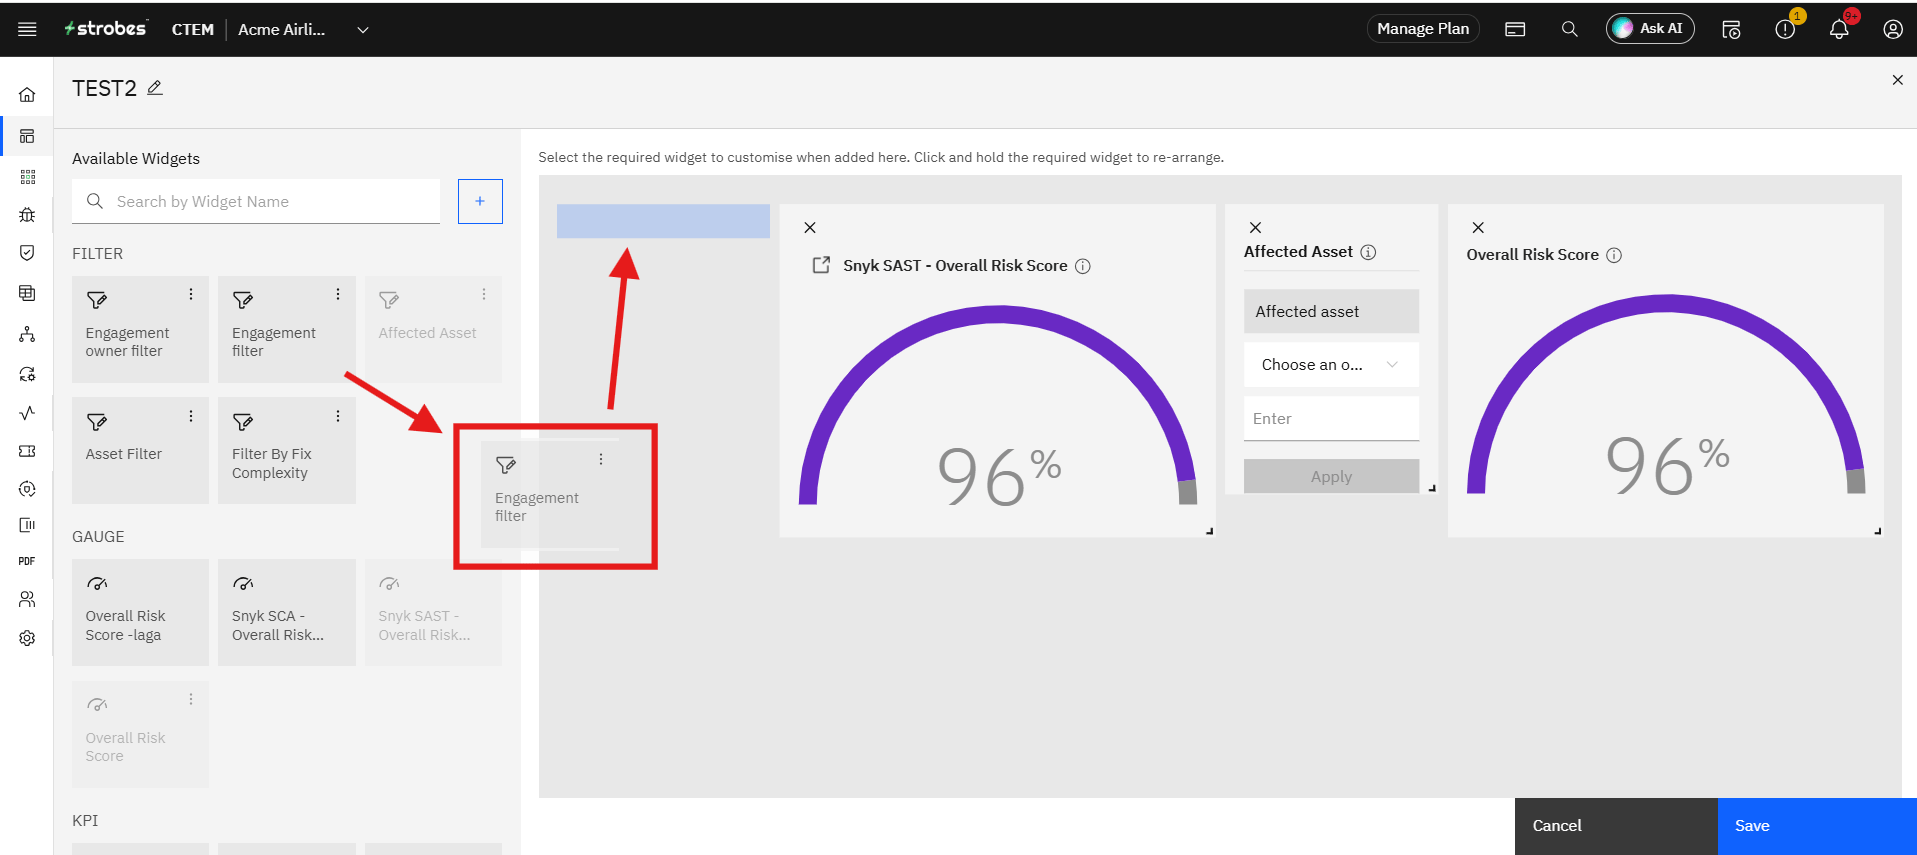
At the top it reads: "Select the required widget to customise when added here. Click and hold the required widget to re-arrange."
To add a widget to the canvas: Click and drag a widget from the Available Widgets panel onto the canvas. The Blue mark shows where you want to place the widget. Once placed, you can click to select it and drag it to rearrange.
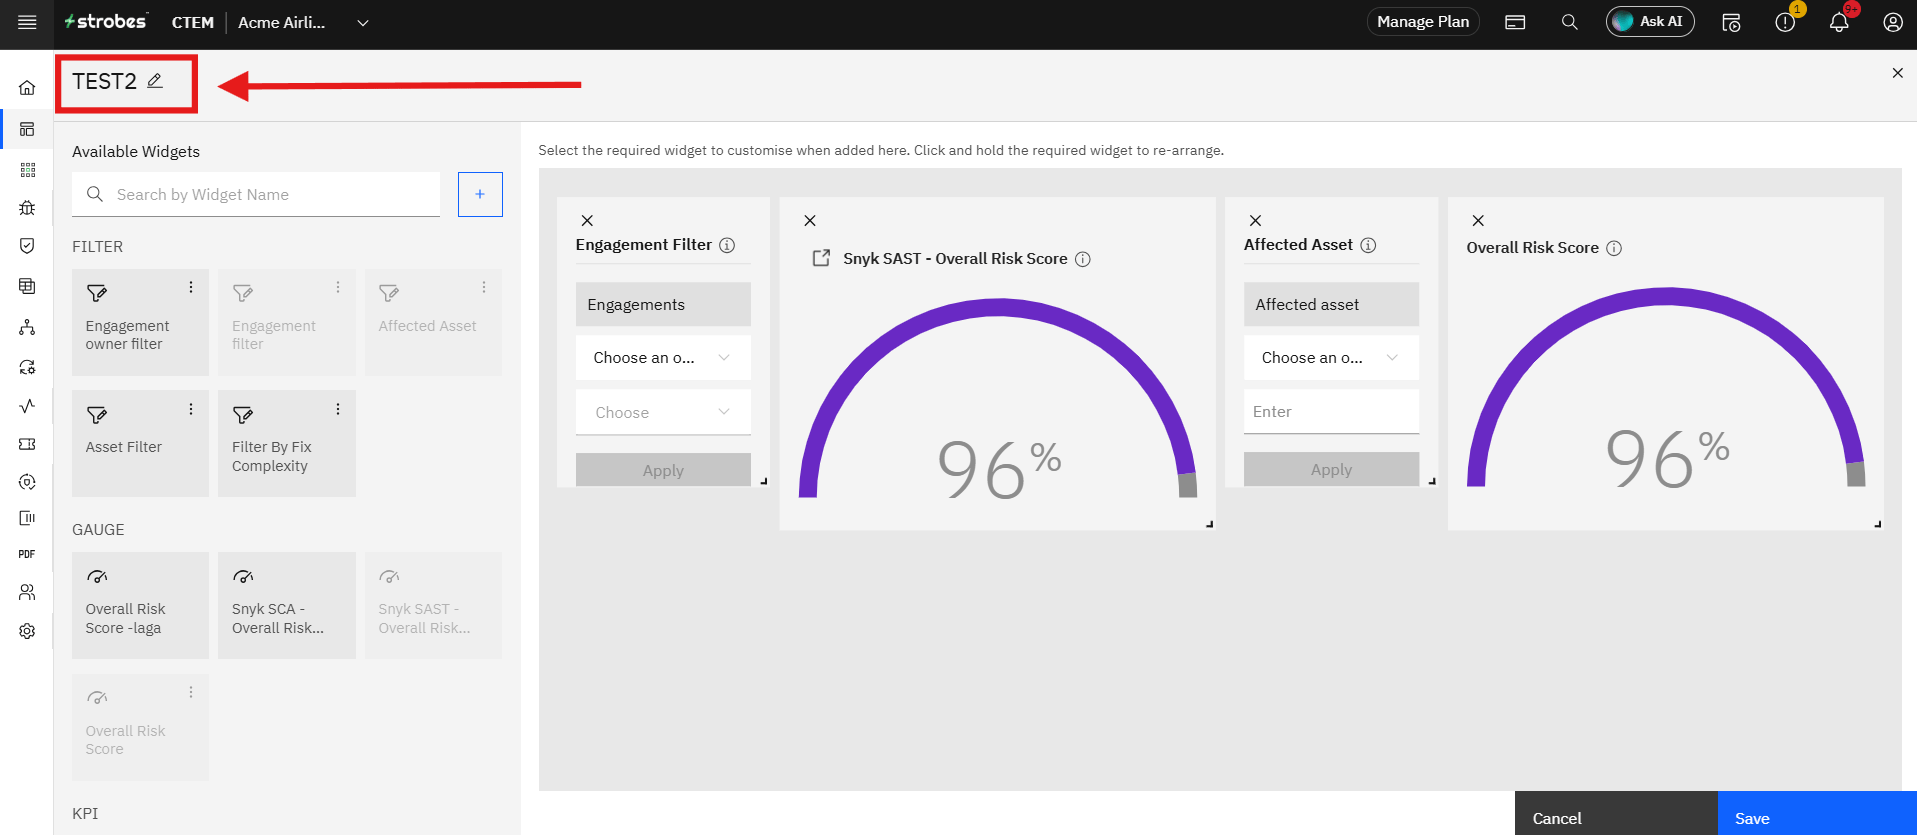
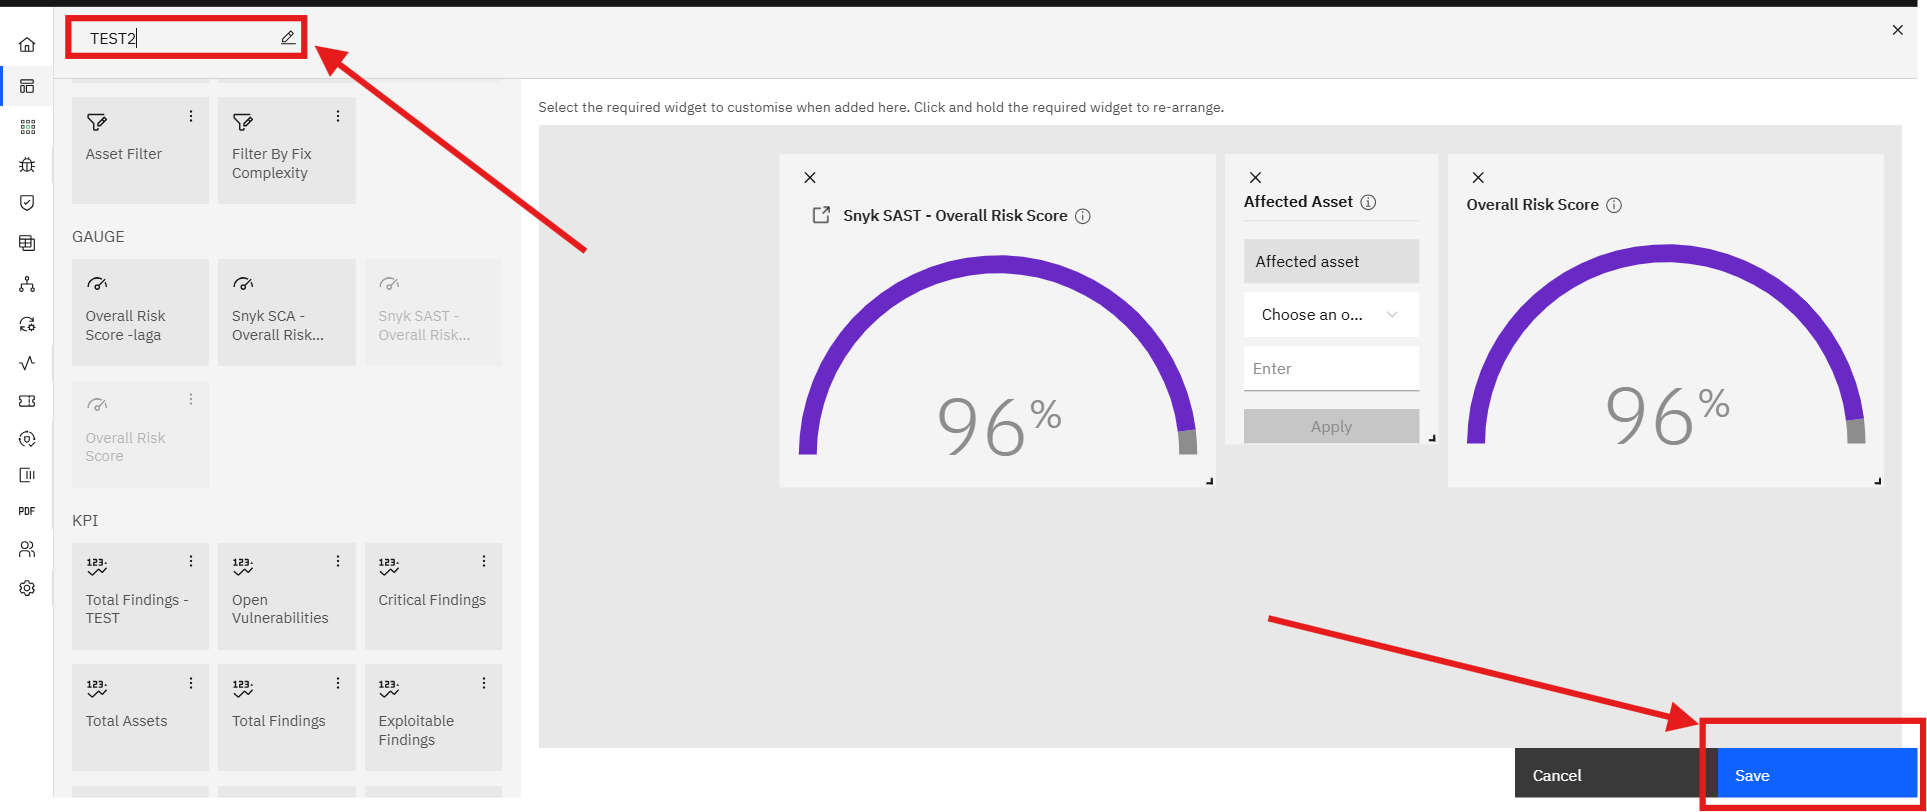
To rename the dashboard: Click the pencil icon next to the "Untitled" title at the top and type a new name.
To save: Click Save at the bottom. Click Cancel to discard changes.
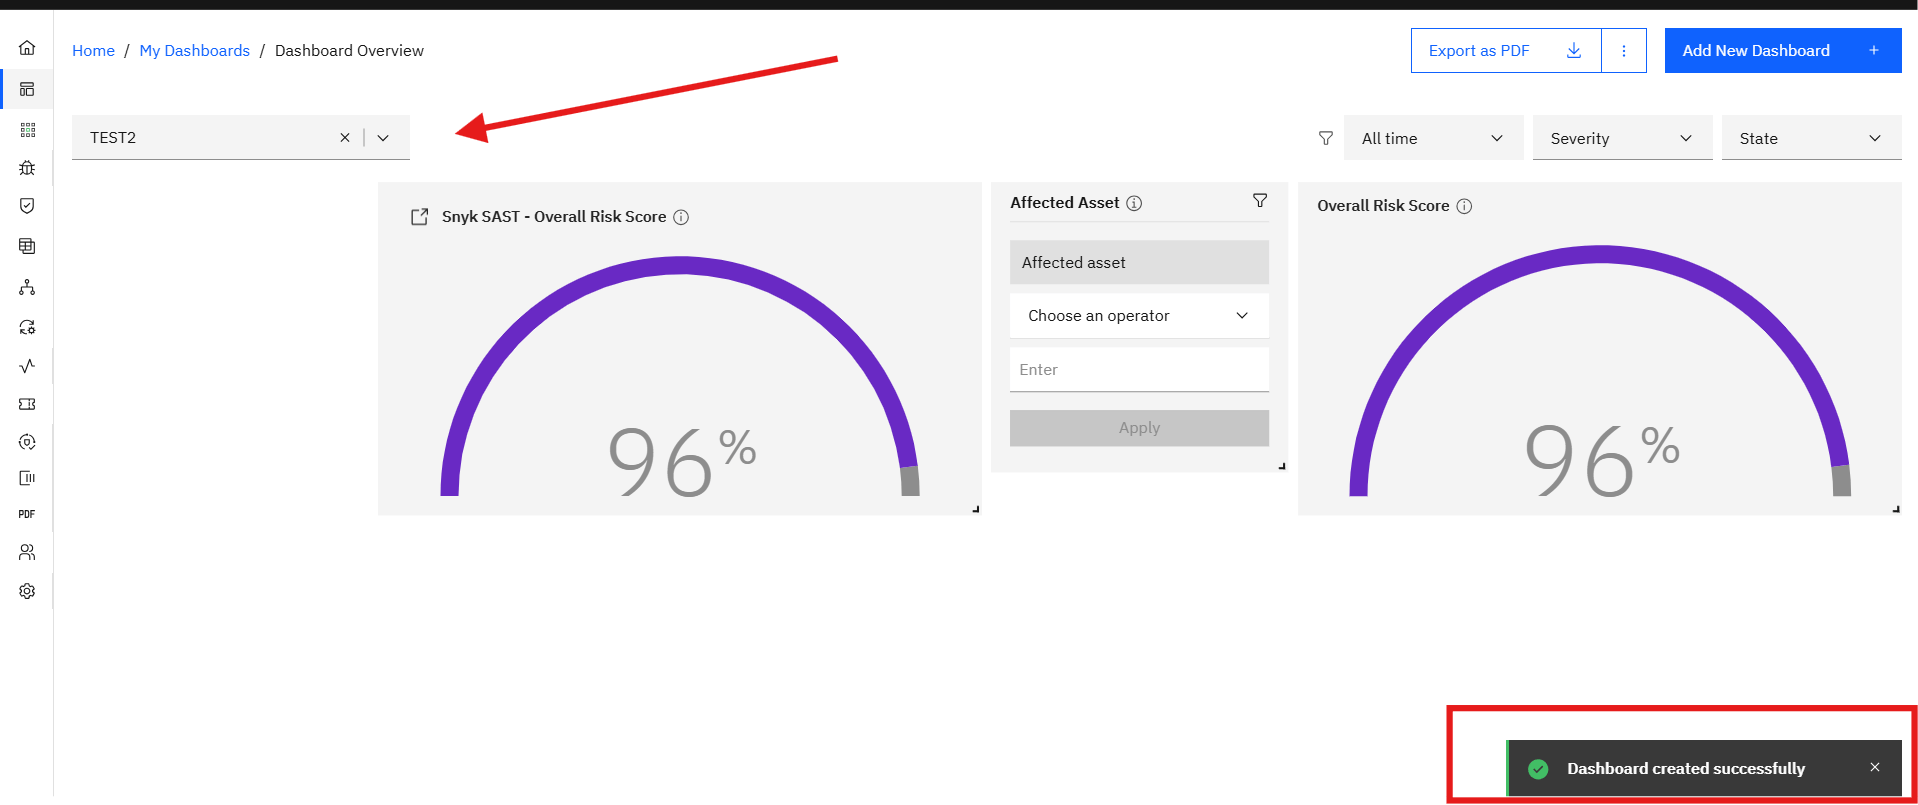
Your dashboard will be created Successfully.
Path 2 — Using Settings > Dashboards (Full Control)
Navigate to Settings (gear icon in the left sidebar) → Dashboards.
This opens the Customize Dashboard page.
The page subtitle reads: "Easily arrange the built widgets on template dashboards tailored to your most important performance indicators."
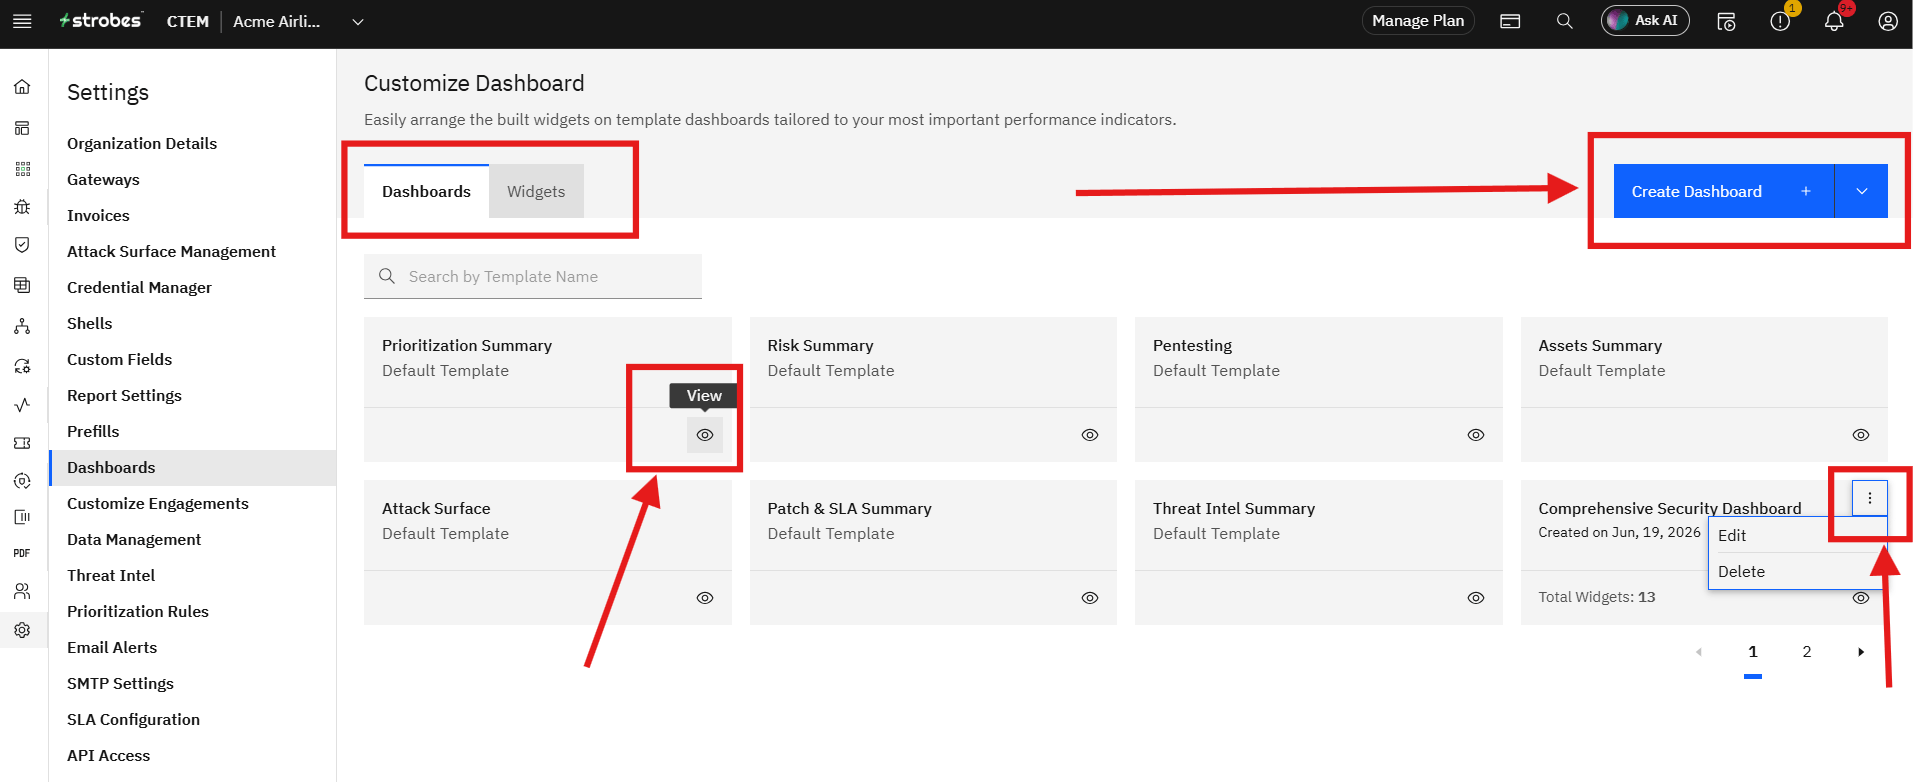
There are two tabs: Dashboards and Widgets.
The Dashboards Tab
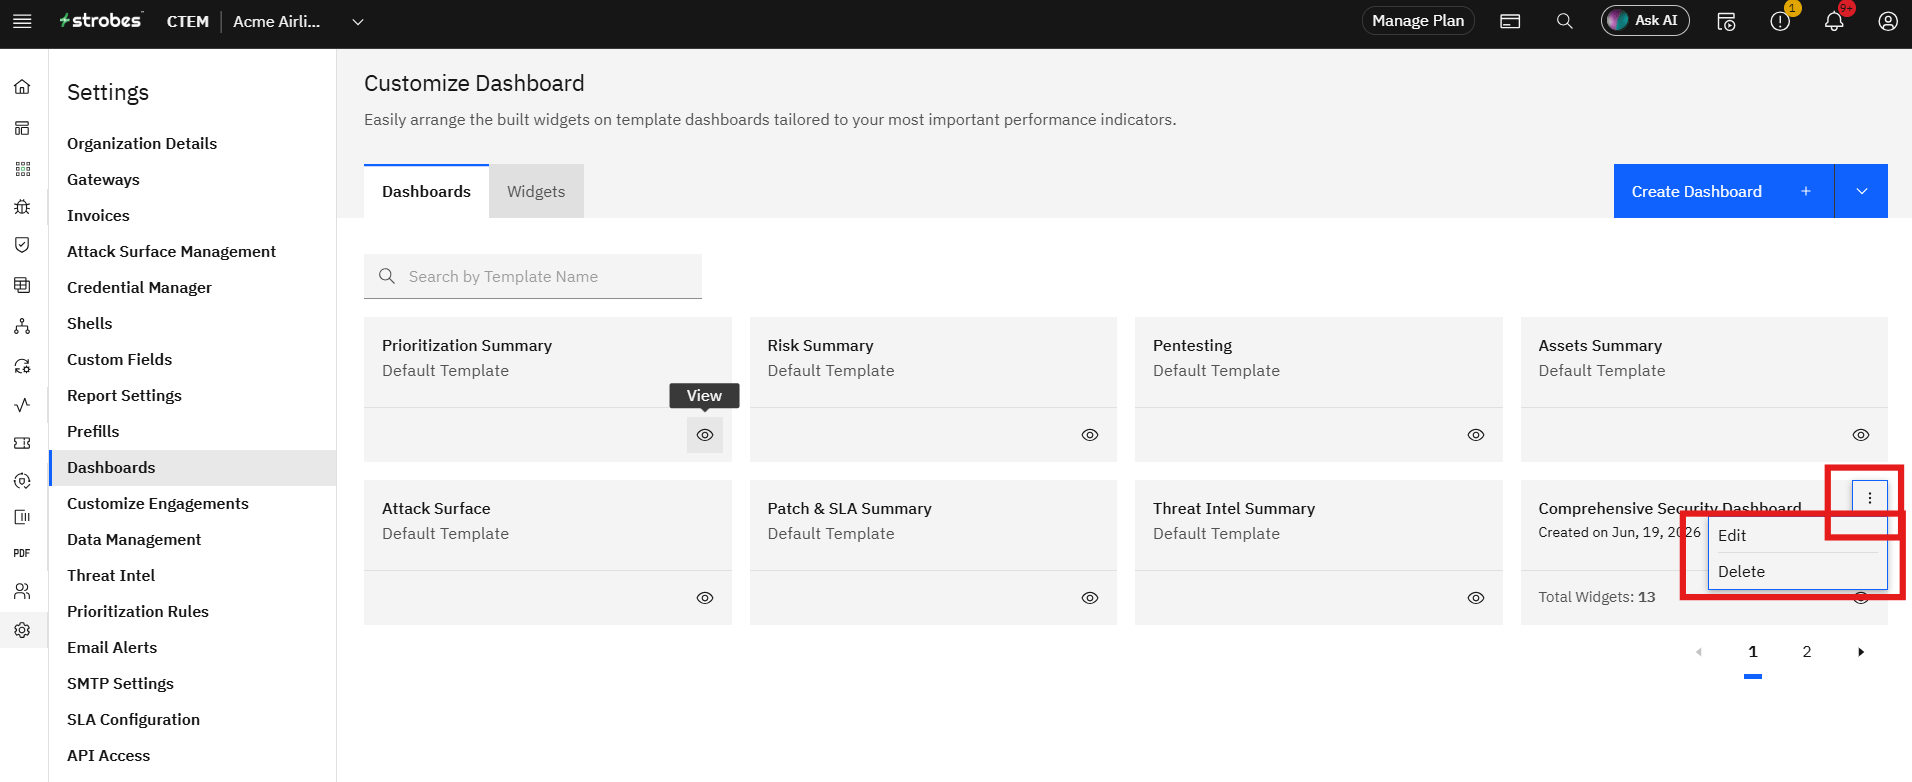
The Dashboards tab lists all dashboards — the same seven default templates plus any custom dashboards your team has created. Each row shows the dashboard name and a preview (eye) icon.
Custom created dashboards show additional information such as Total Widgets: 13 and a ⋮ menu with Edit and Delete options.
Creating a Dashboard from Settings
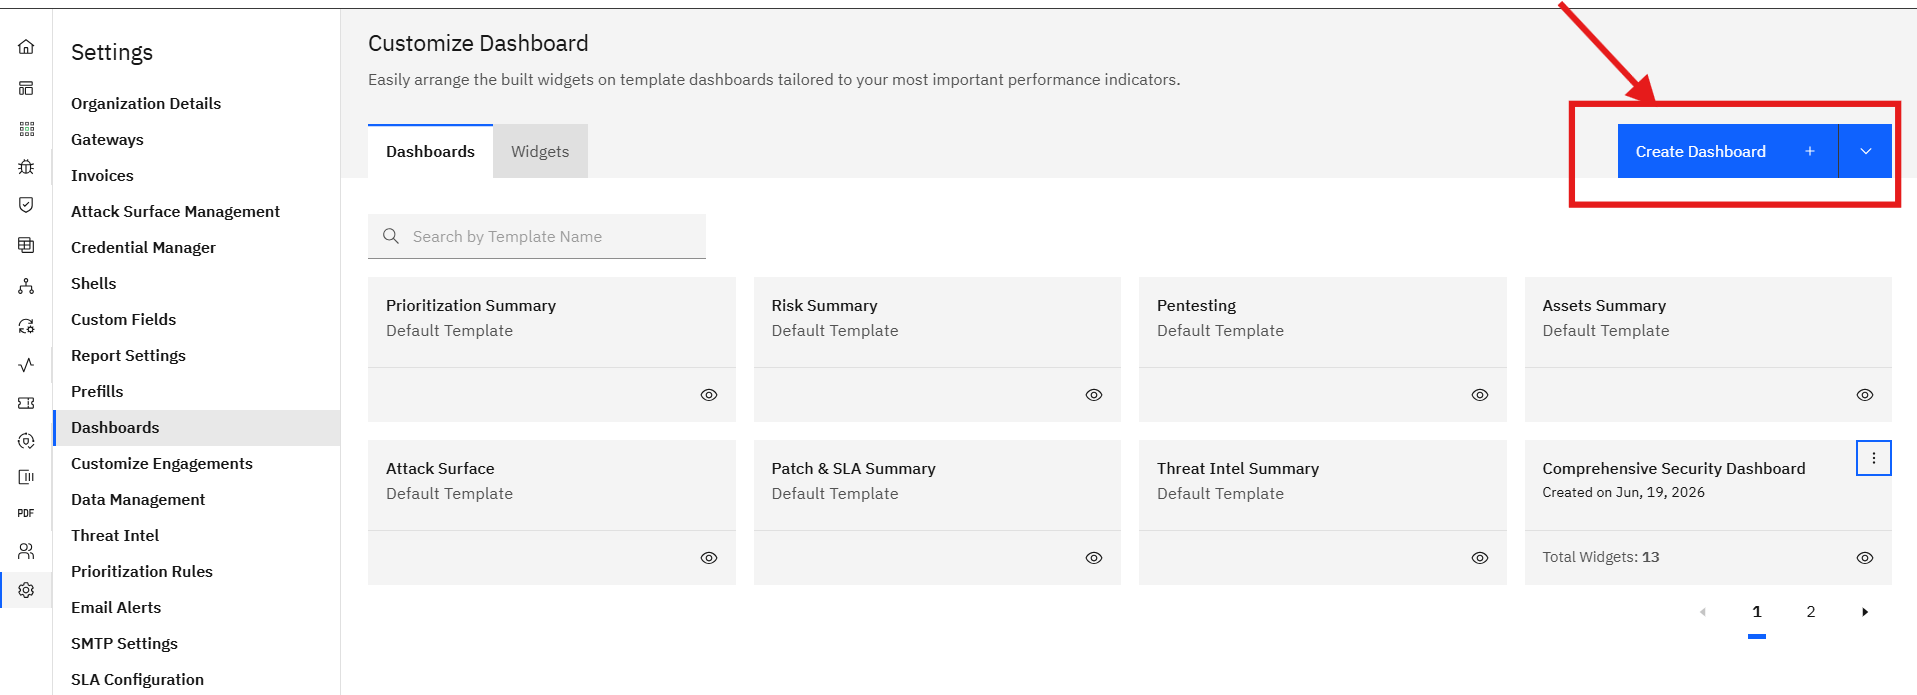
Click the Create Dashboard button (blue, top right) to create a new custom dashboard. This opens the dashboard builder.
The Dashboard Builder
The builder has two areas:
Left panel — Available Widgets
- A search box to find widgets by name
- A + button to create a new widget (opens the Add Widget form — see the Creating a Widget section below)
- Widgets organized into categories:
- FILTER — e.g., Engagement owner filter, Engagement filter, Affected Asset, Asset Filter, Filter By Fix Complexity
- GAUGE — e.g., Overall Risk Score, Snyk SCA - Overall Risk, Snyk SAST - Overall Risk
- KPI — metric-style widgets
Canvas (right) Displays the instruction: "Customize Your Own Dashboards — Please drag and drop the required widgets to create a template."
Follow the step III from the Path 1 to add Widgets.
Tips
Use Settings > Dashboards when you need data control. The main Dashboards page is great for quickly viewing default templates. Settings > Dashboards is where you go when you need widgets scoped to specific data subsets, custom calculations, or a layout built for a particular audience (e.g., a CISO-facing risk dashboard vs. a team-level patching tracker).
Build widgets before building dashboards. Create all the widgets you need in the Widgets tab first, then assemble them in the dashboard builder. This way you can preview each widget's data before committing to a layout.
The live preview is real data. The widget preview on the Add Widget page pulls from your actual environment — what you see is what will appear on the dashboard. If the preview looks wrong, adjust the Measure or Data source before saving.
Use "Apply filters" on KPI and chart widgets. Toggling Apply filters on means your custom widgets respond to the Asset View and Findings View filter dropdowns on the dashboard — the same way default template widgets do. This makes custom dashboards as interactive as the built-in templates.
Pair filters for precise scoping. On any dashboard, combining an Asset View filter (e.g., "Windows assets") with a Findings View filter (e.g., "SLA Violated") instantly scopes every widget to that intersection — no manual cross-referencing required.
Use "Construct Query" for one-off analysis. Both filter dropdowns on the main Dashboards page offer a Construct Query option. Write a one-off filter expression without saving a permanent view — ideal when you're investigating a specific incident.
Schedule & Email for stakeholder reporting. If you send a weekly or monthly dashboard to leadership, set up Schedule & Email once so it goes out automatically.
More in Dashboards
Was this page helpful?