
Patch & SLA Summary
1 min readEdit
On this page⌄
About This Dashboard
Patch & SLA summary dashboard makes you deep-dive into the overall patch status and workload of your teams.
At a Glance
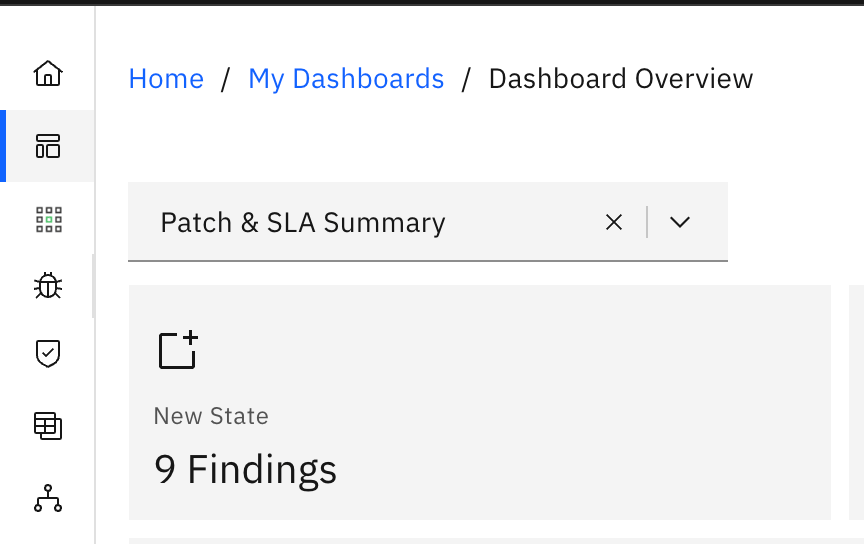
This card highlights the total count of vulnerabilities in New State. Please note that for these vulnerabilities, SLA is not activated.
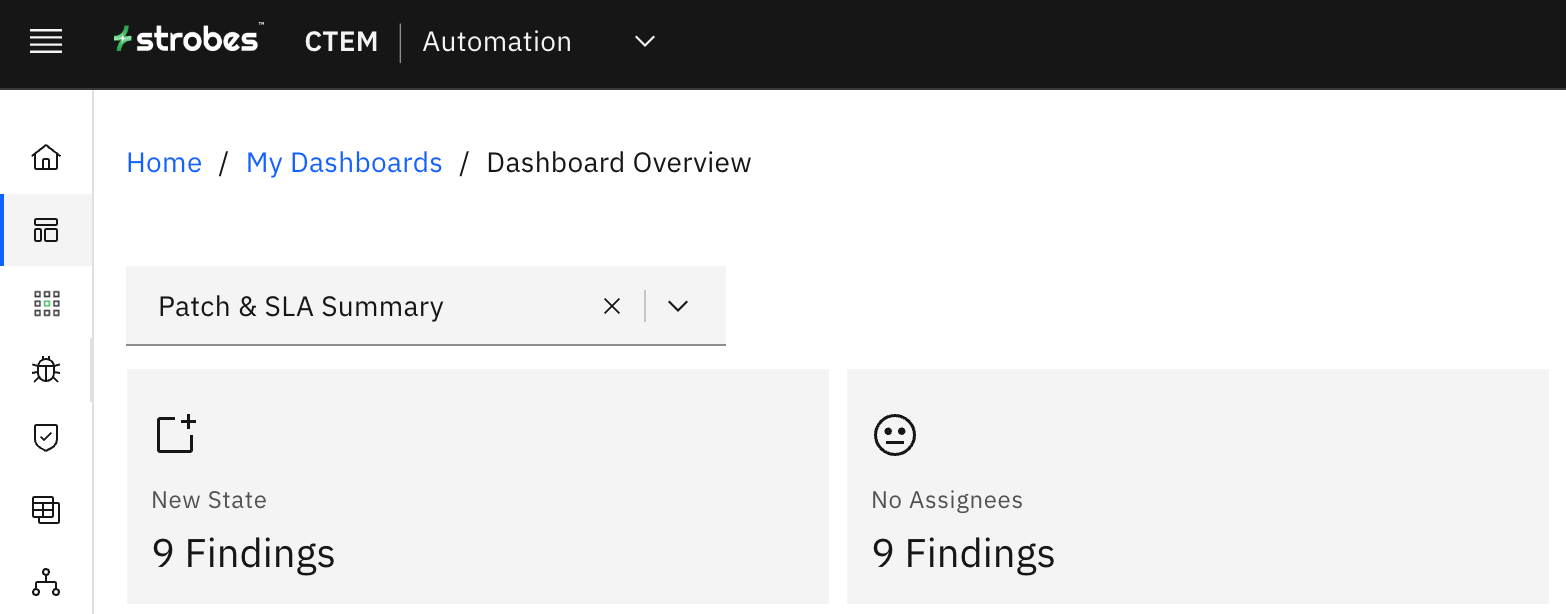
This card highlights the total count of vulnerabilities that don't have any assignees.
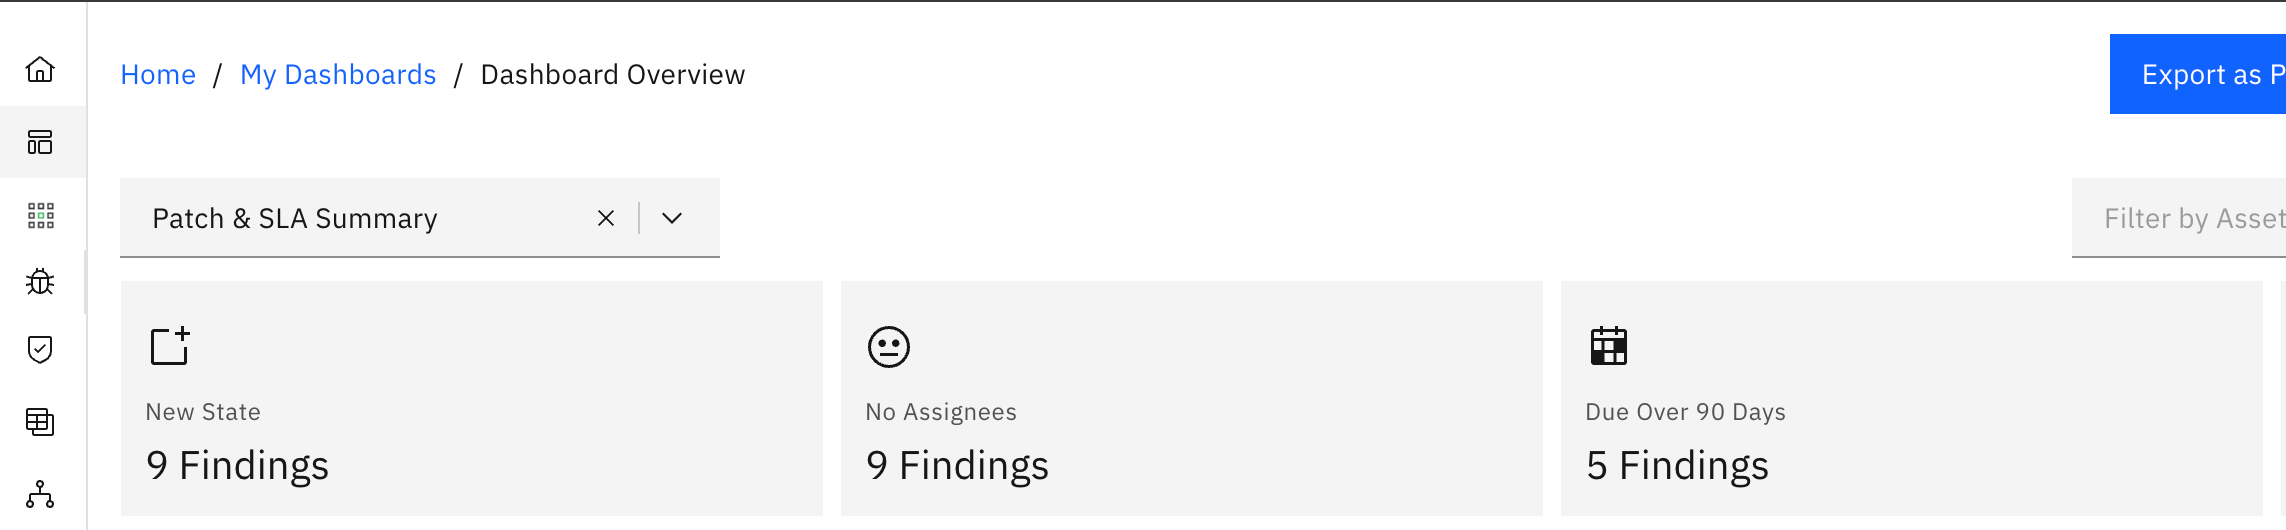
This card highlights the total number of vulnerabilities that are yet to be resolved and whose SLA was violated over 90 days ago.
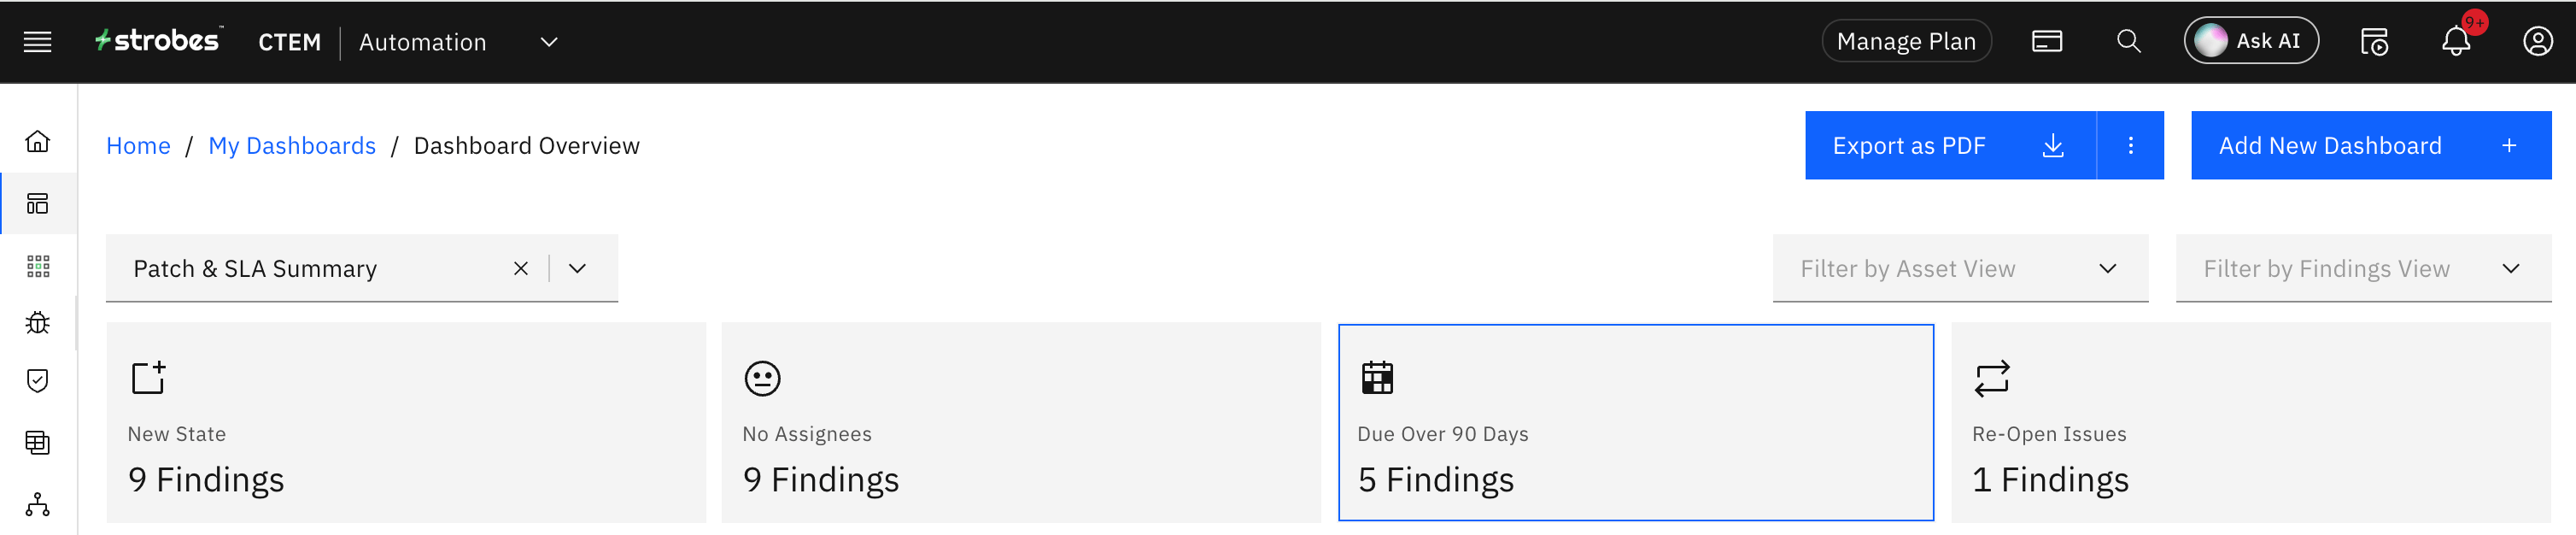
This card highlights the total number of vulnerabilities that were opened again after marking them as Resolved.
Vulnerabilities without SLA
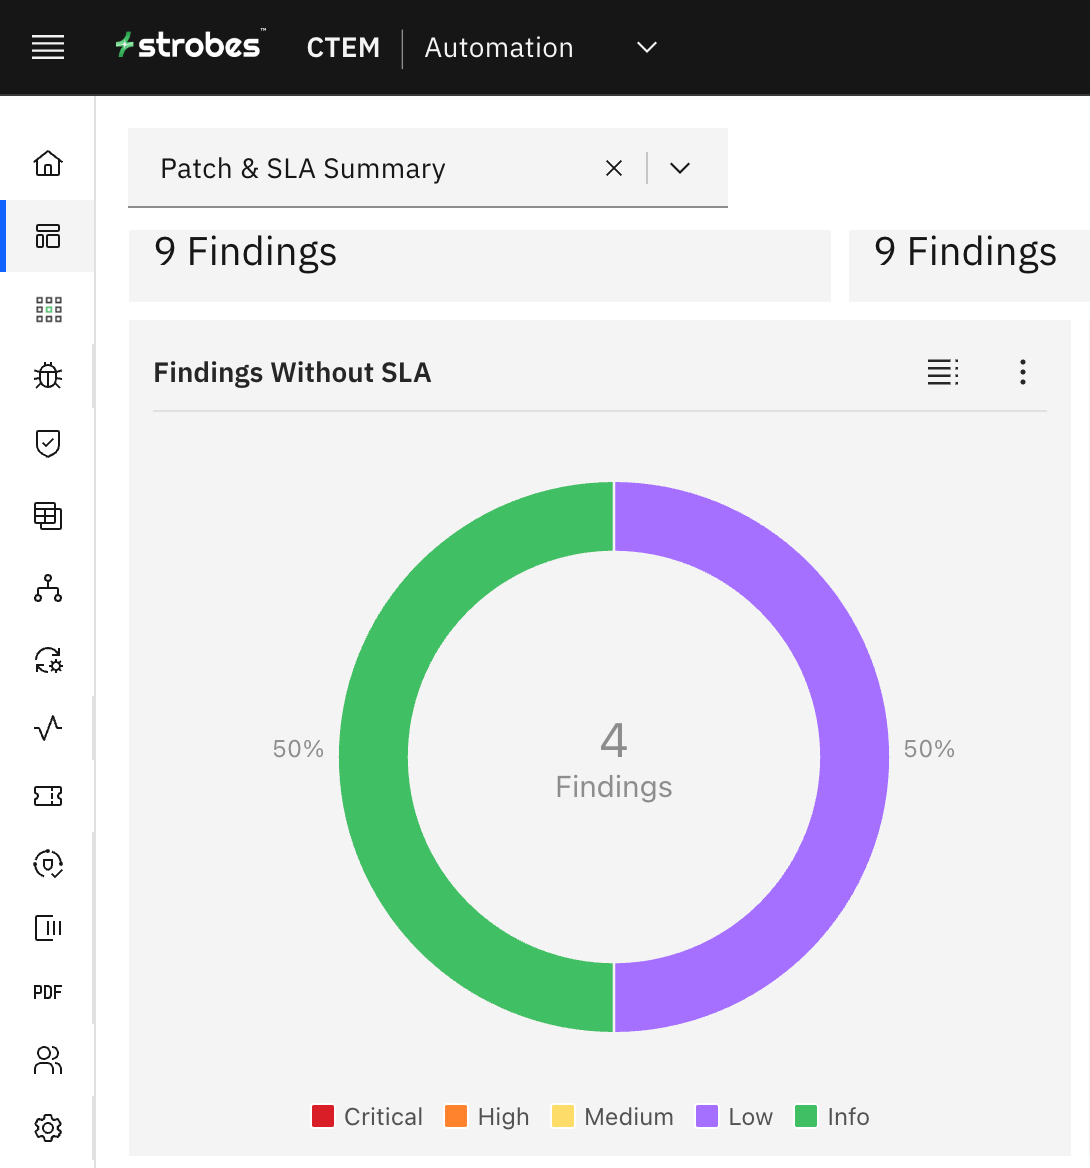
This chart shows you the distribution of vulnerabilities that don't have SLA based on severity.
SLA Status
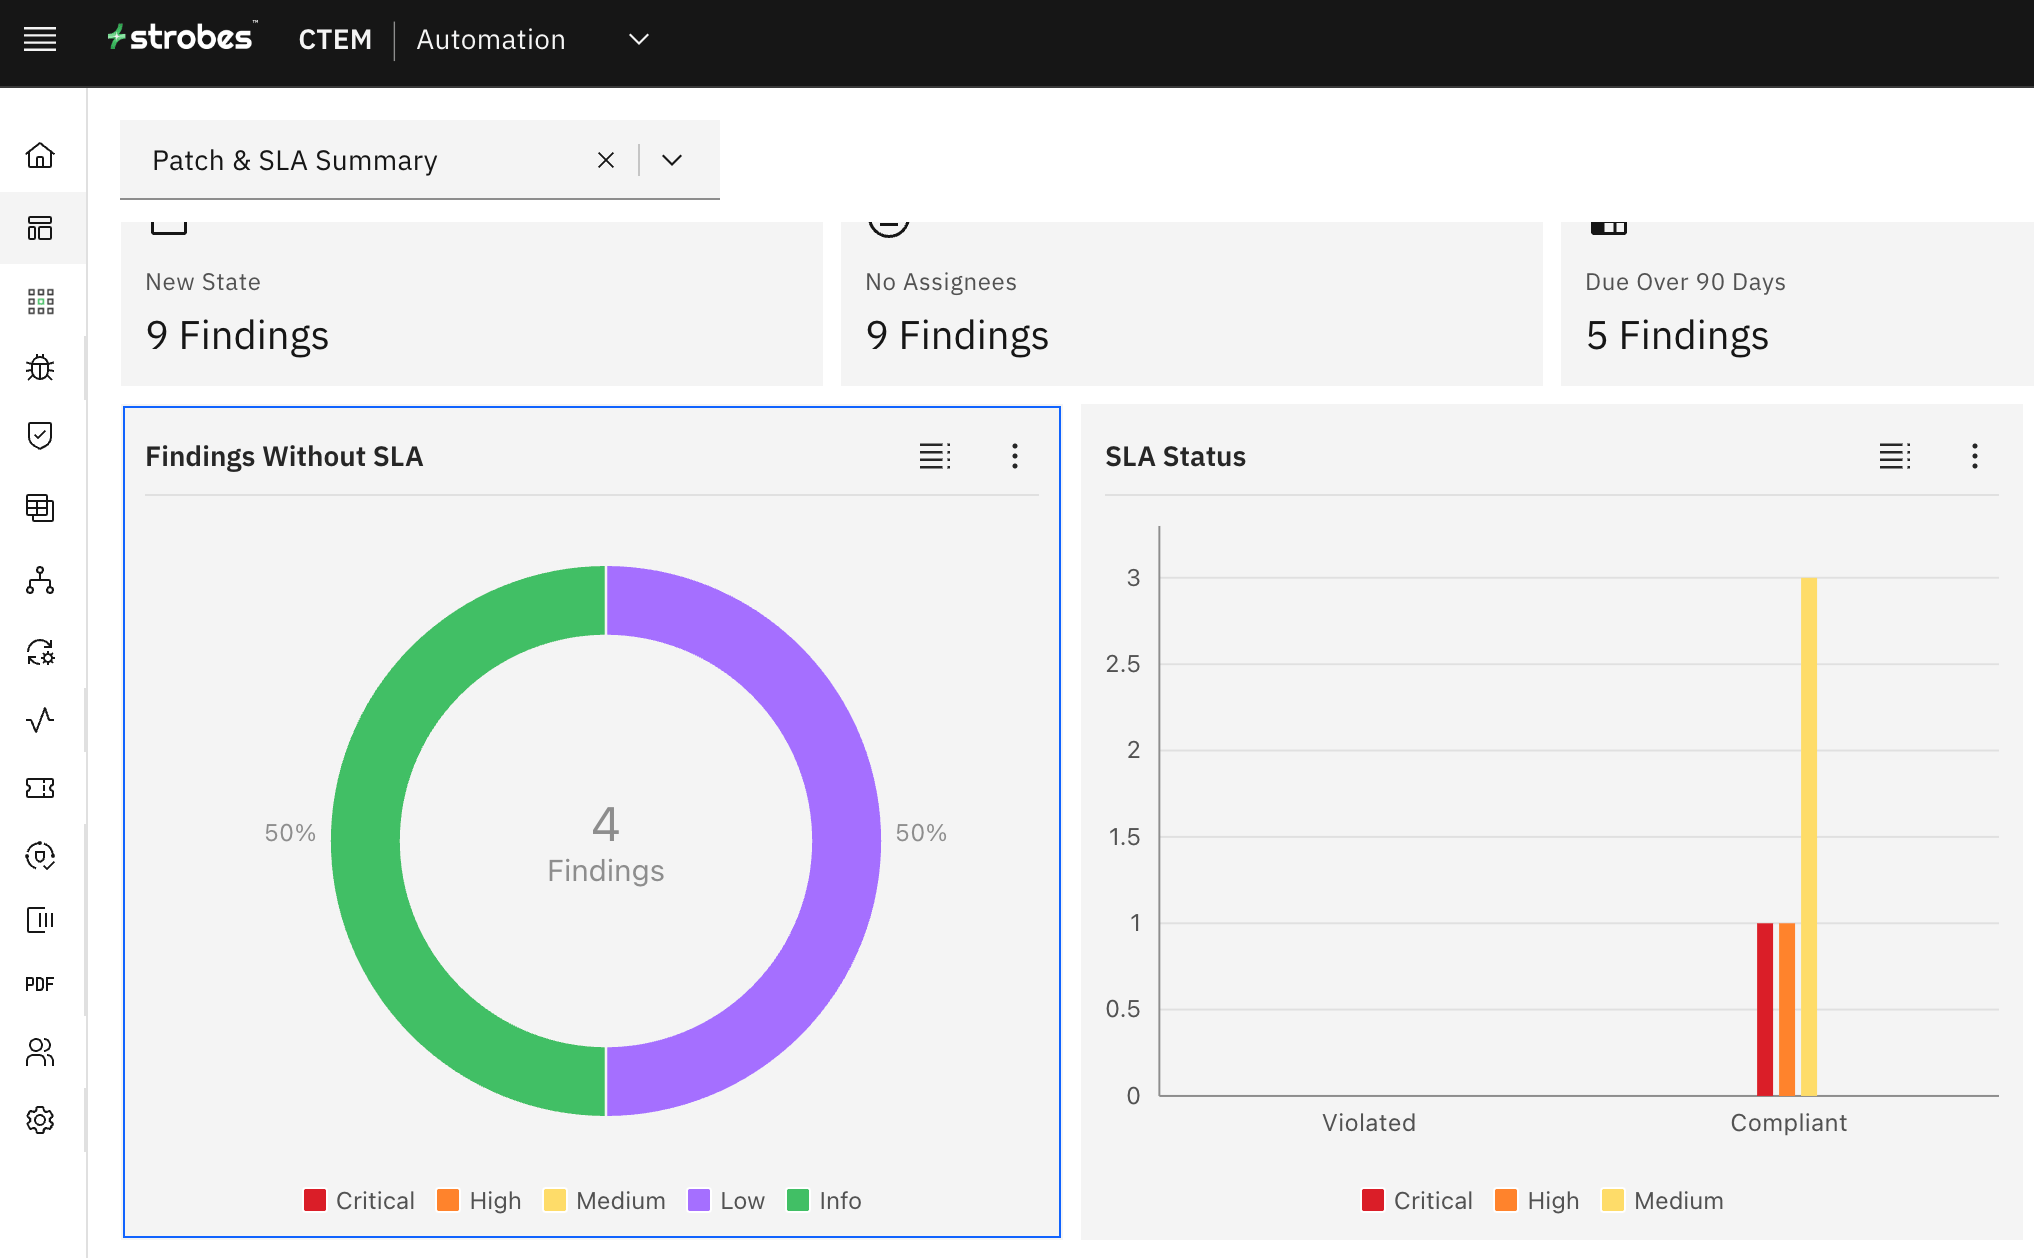
This chart shows you the distribution of vulnerabilities and their SLA status based on severity.
Assignees Workload
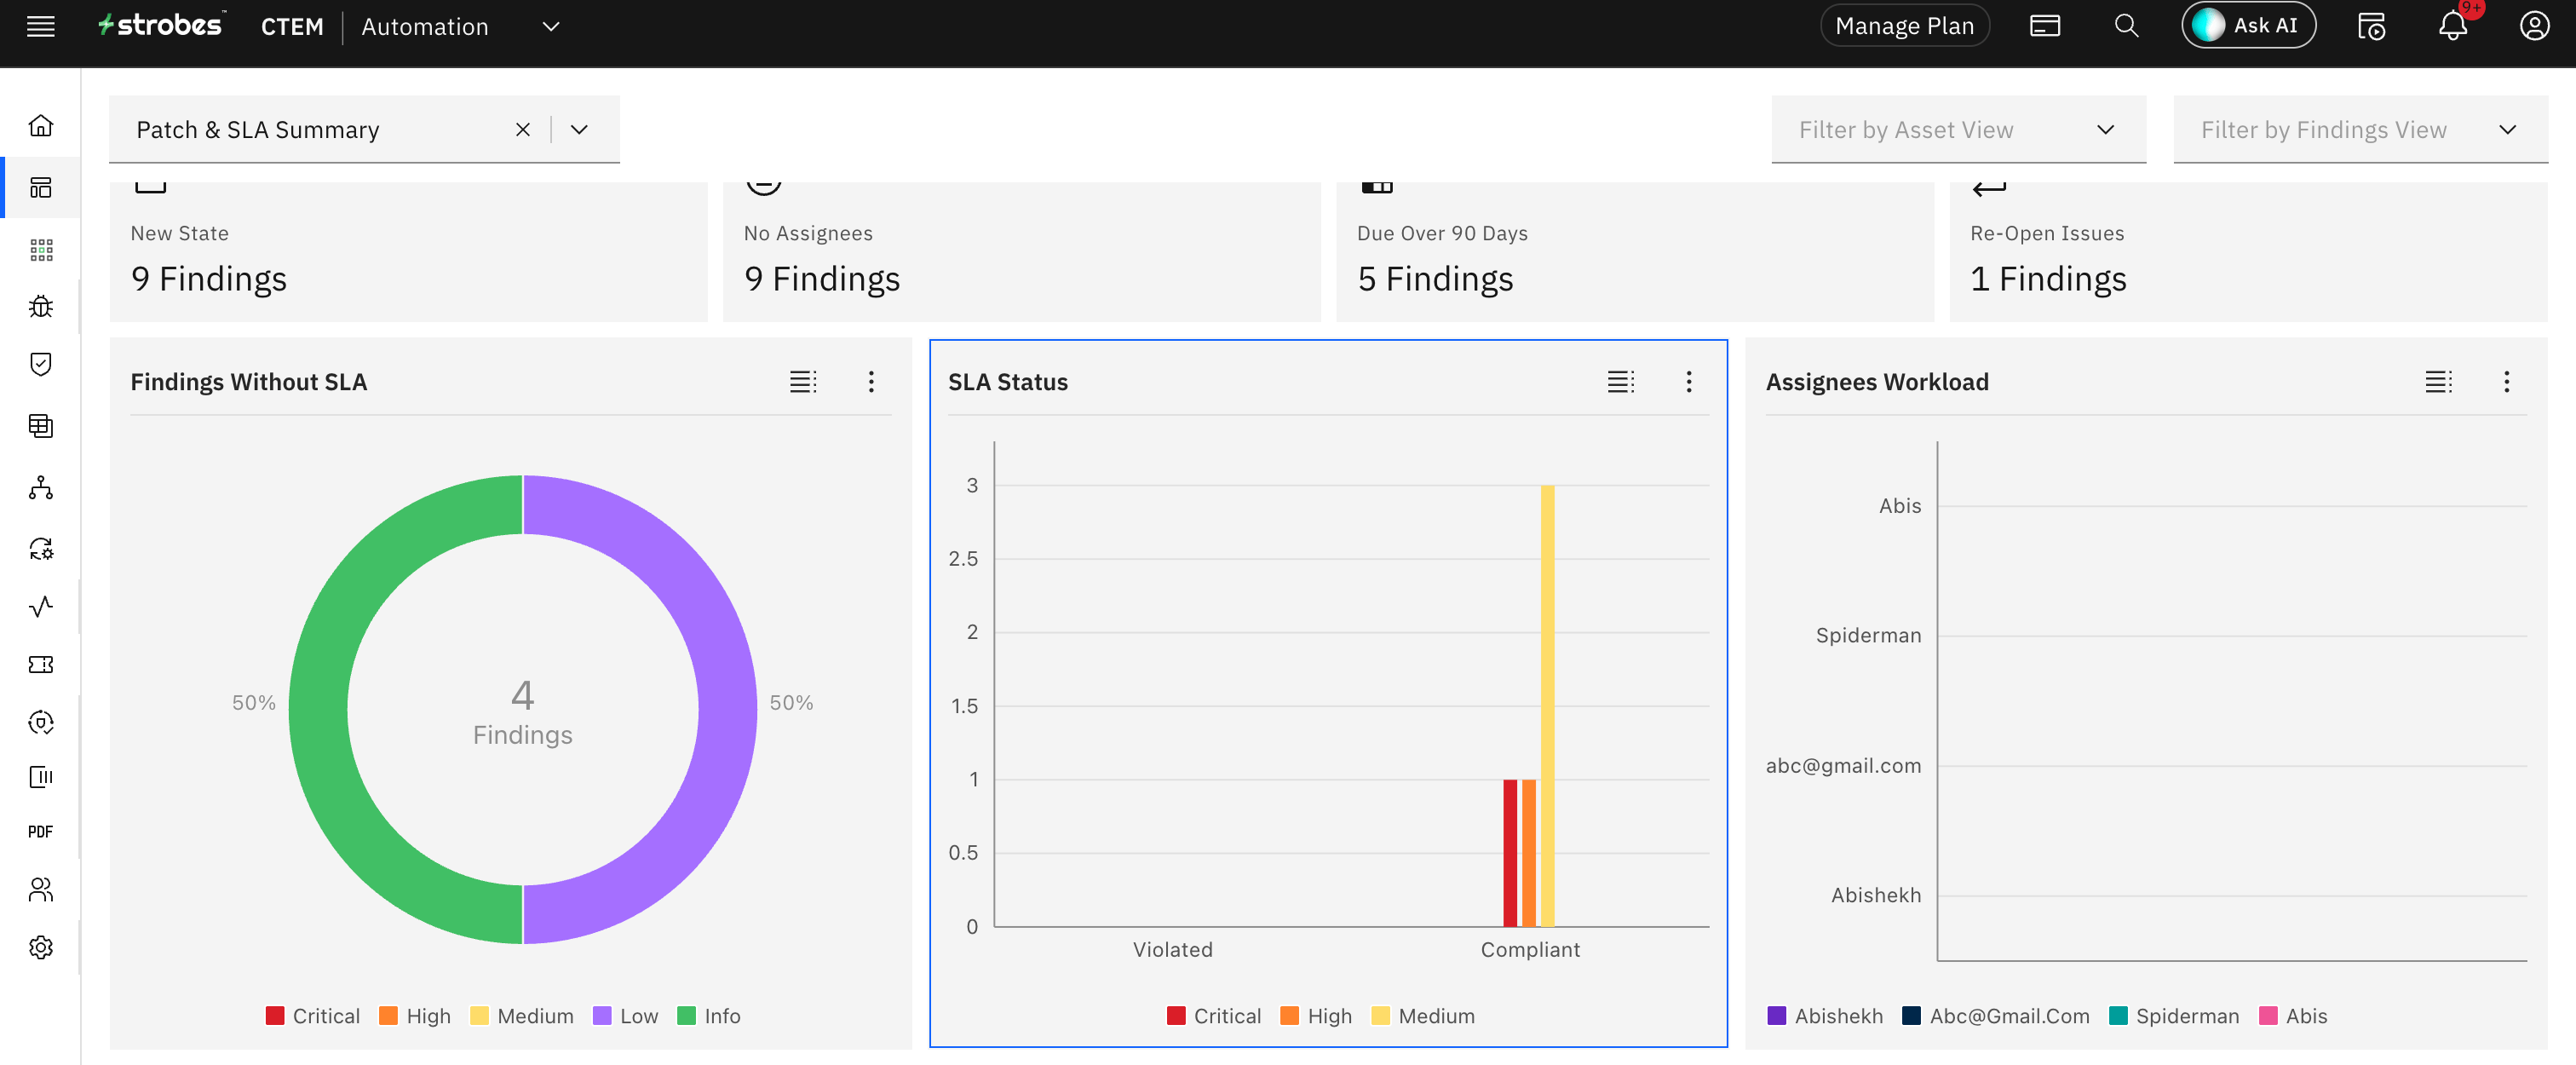
This chart gives you a visual insight into the total number of vulnerabilities that were assigned to your team and out of which how many were closed. This information helps you keep track of the workload of your teams.
State vs SLA Mapping
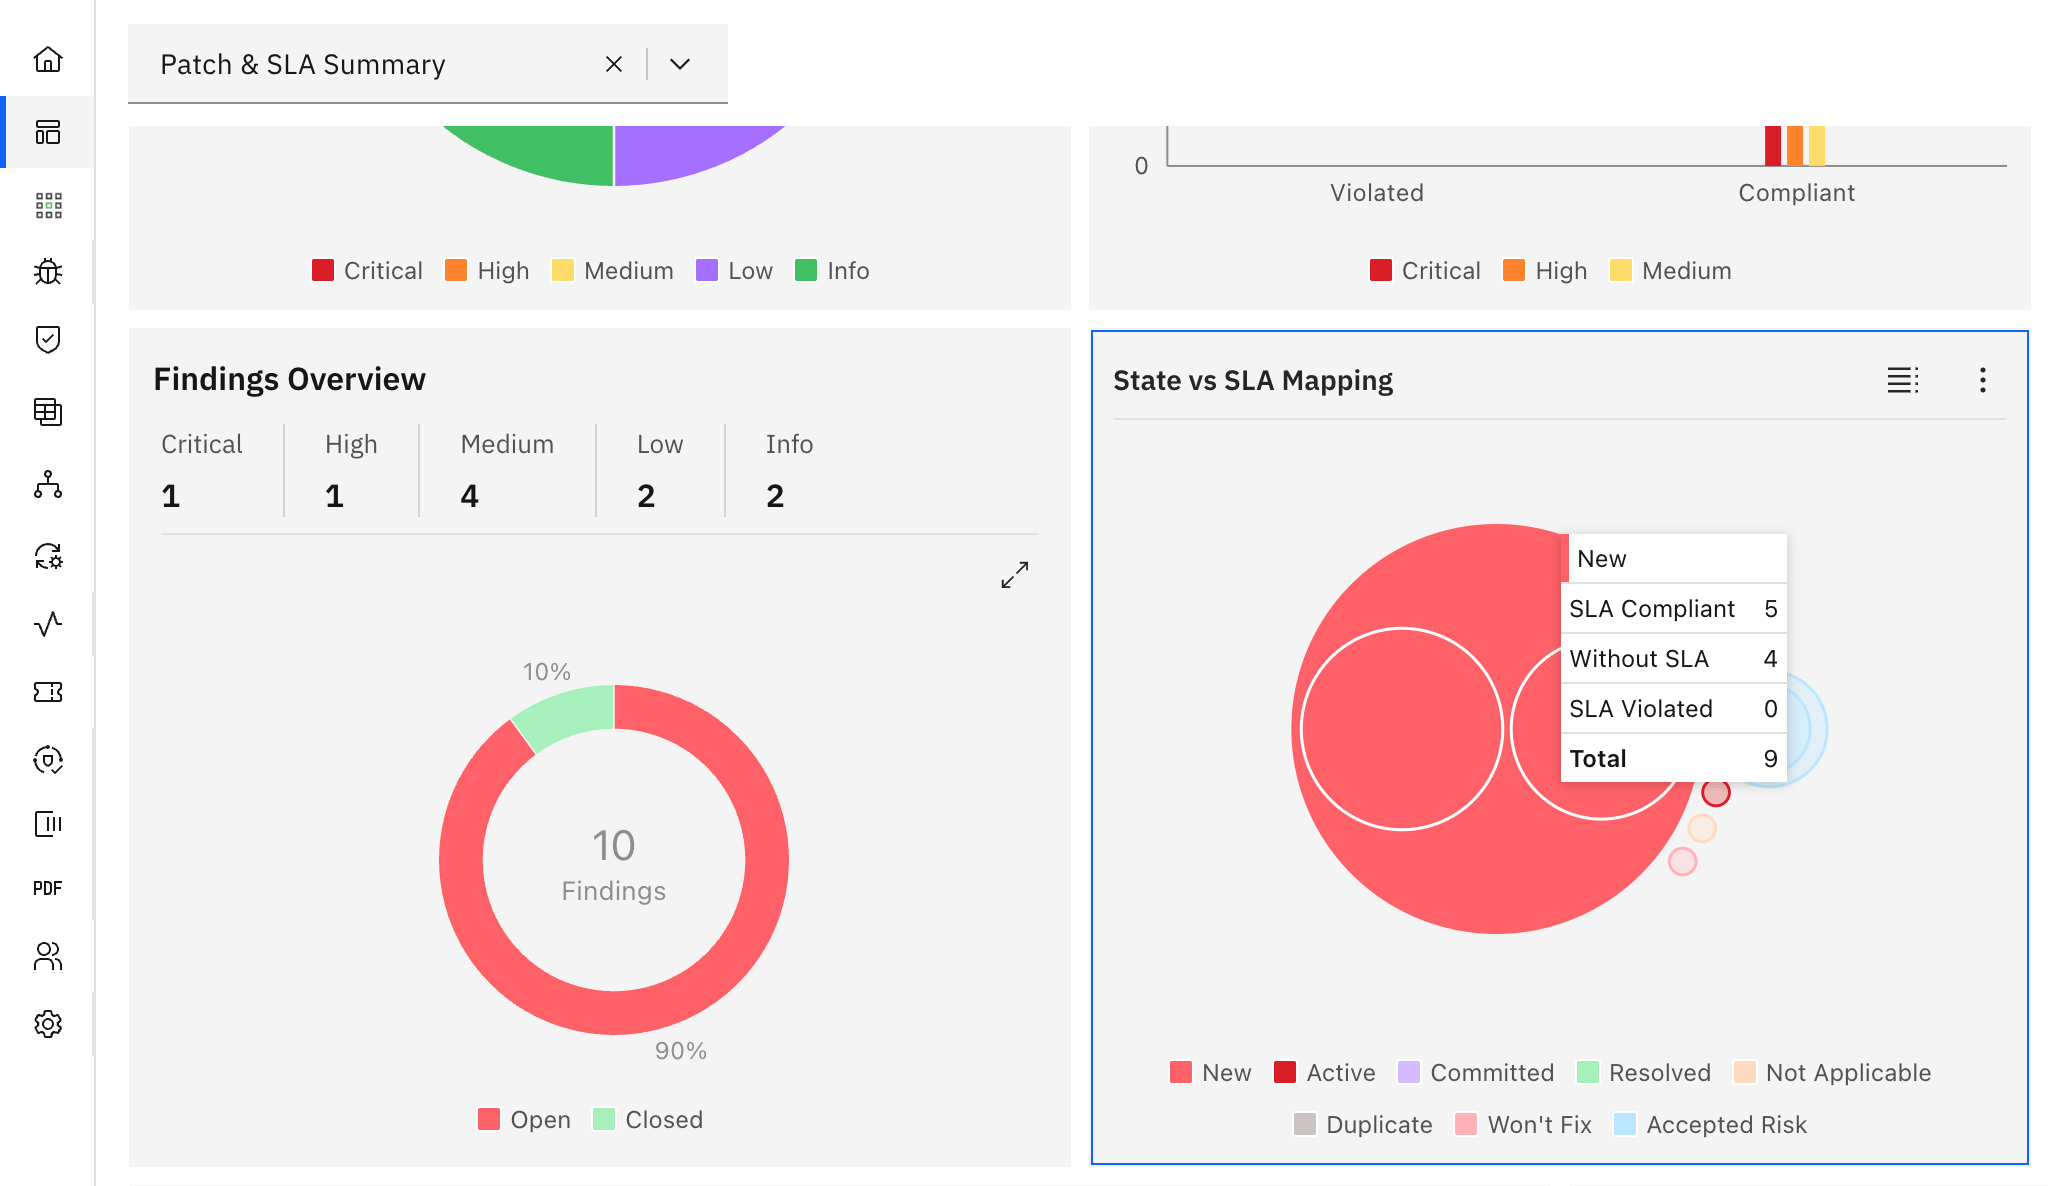
This chart maps the SLA status with the vulnerability states. Hover over the bubbles to interact with the chart.
Turn-around-time to Resolve Vulnerabilities
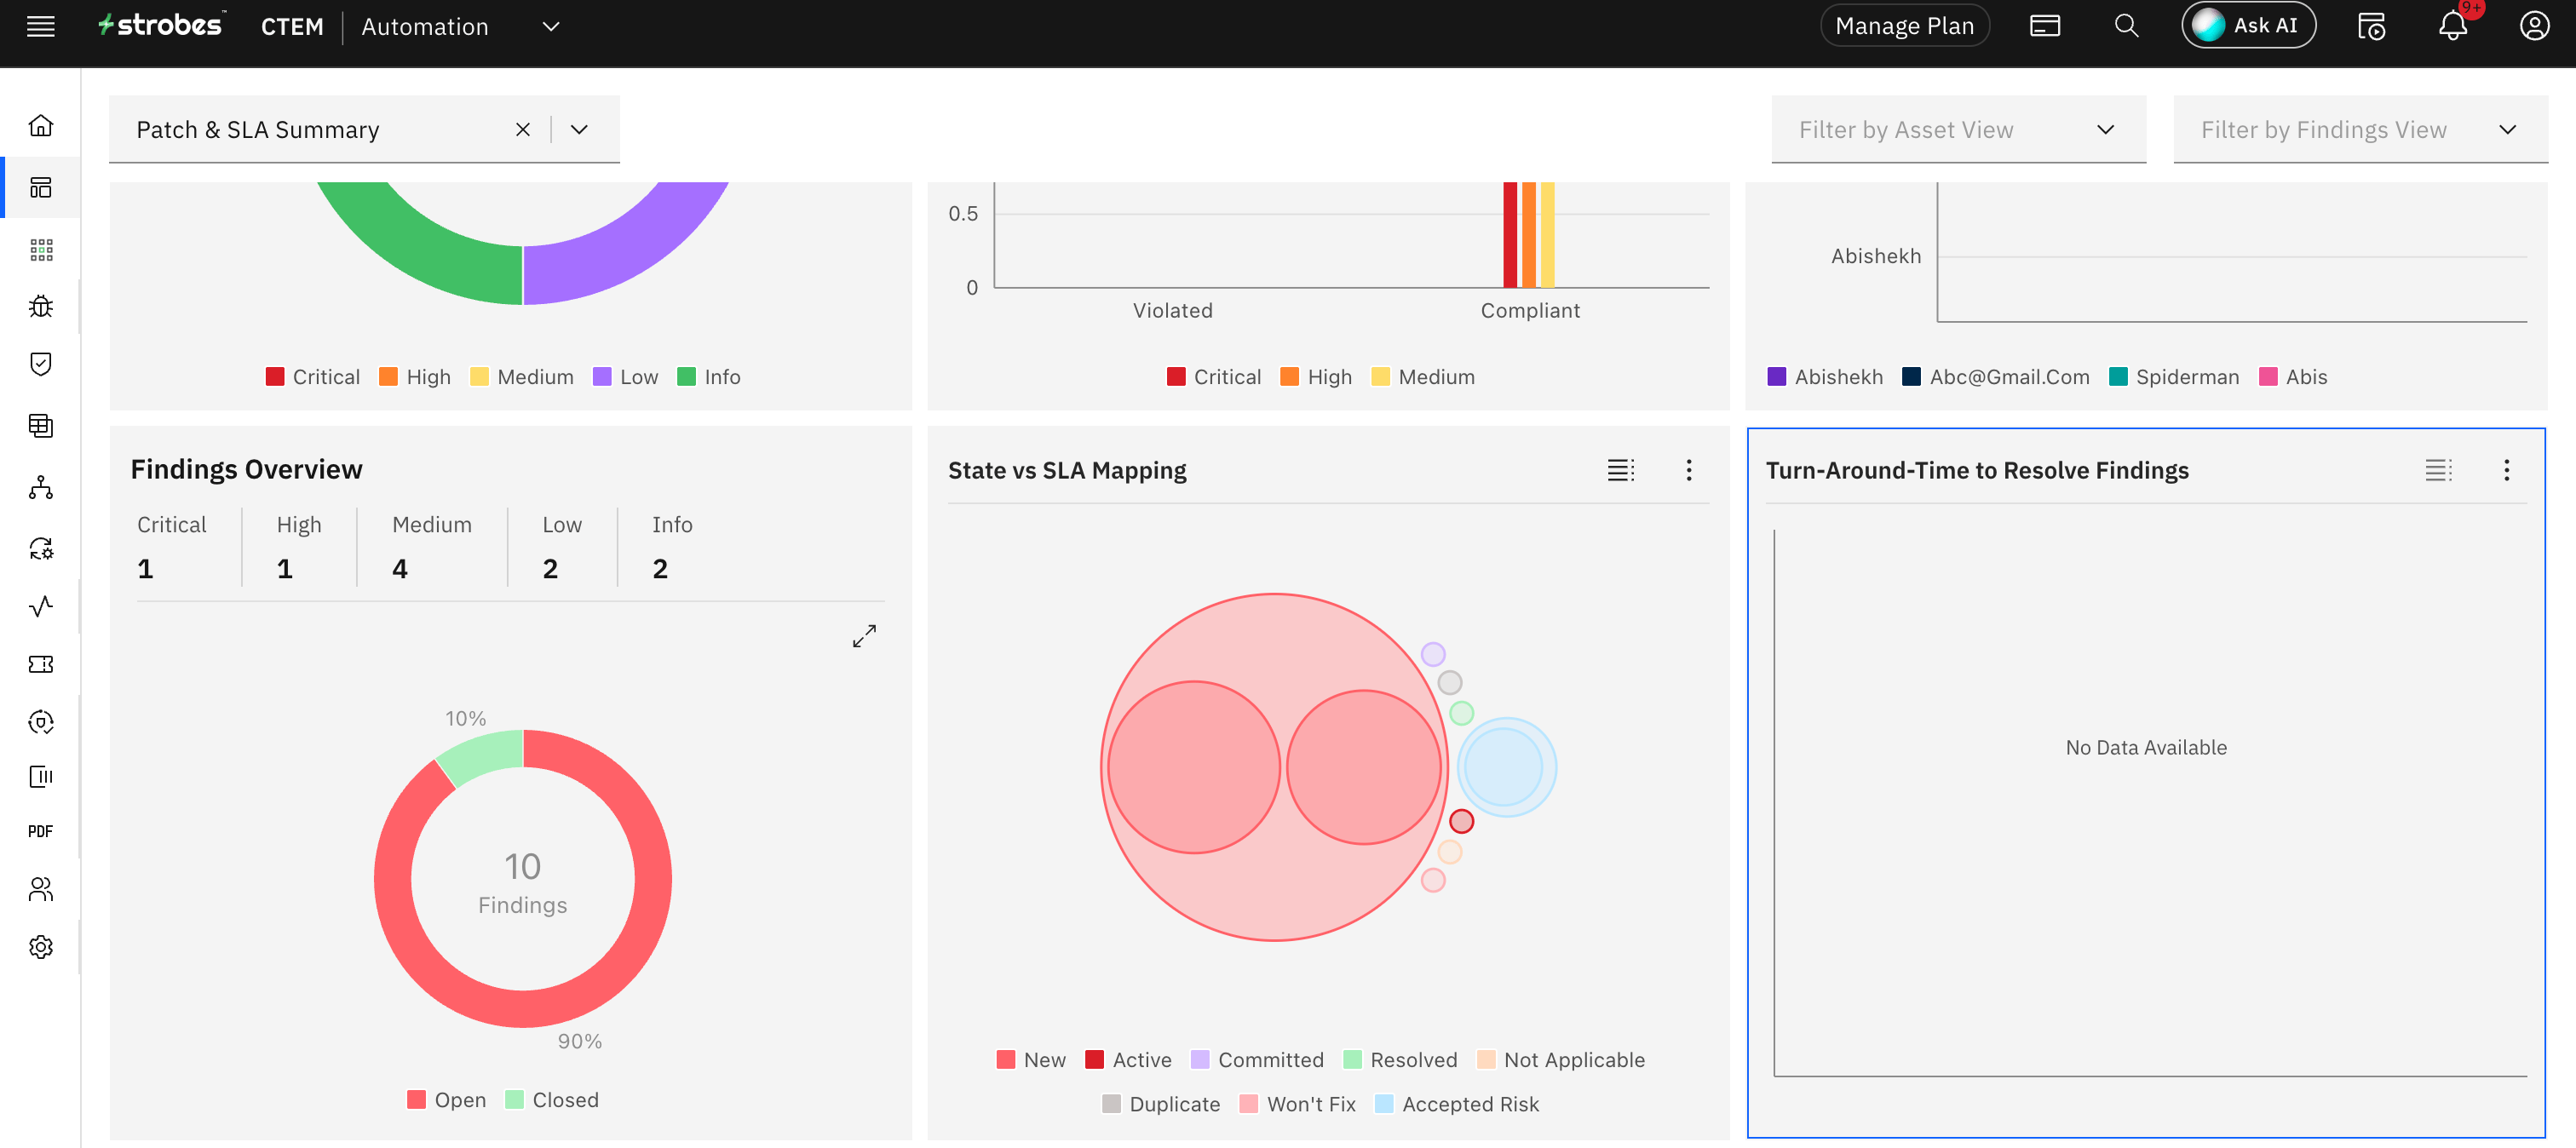
This chart gives you an insight into the average amount of time that your teams are taking to resolve a vulnerability.
More in Default dashboards
Was this page helpful?