
Attack Surface Monitoring Template
3 min readEdit
On this page⌄
- Accessing the Attack Surface Monitoring Template
- Step 1: Select the Attack Surface Monitoring Template
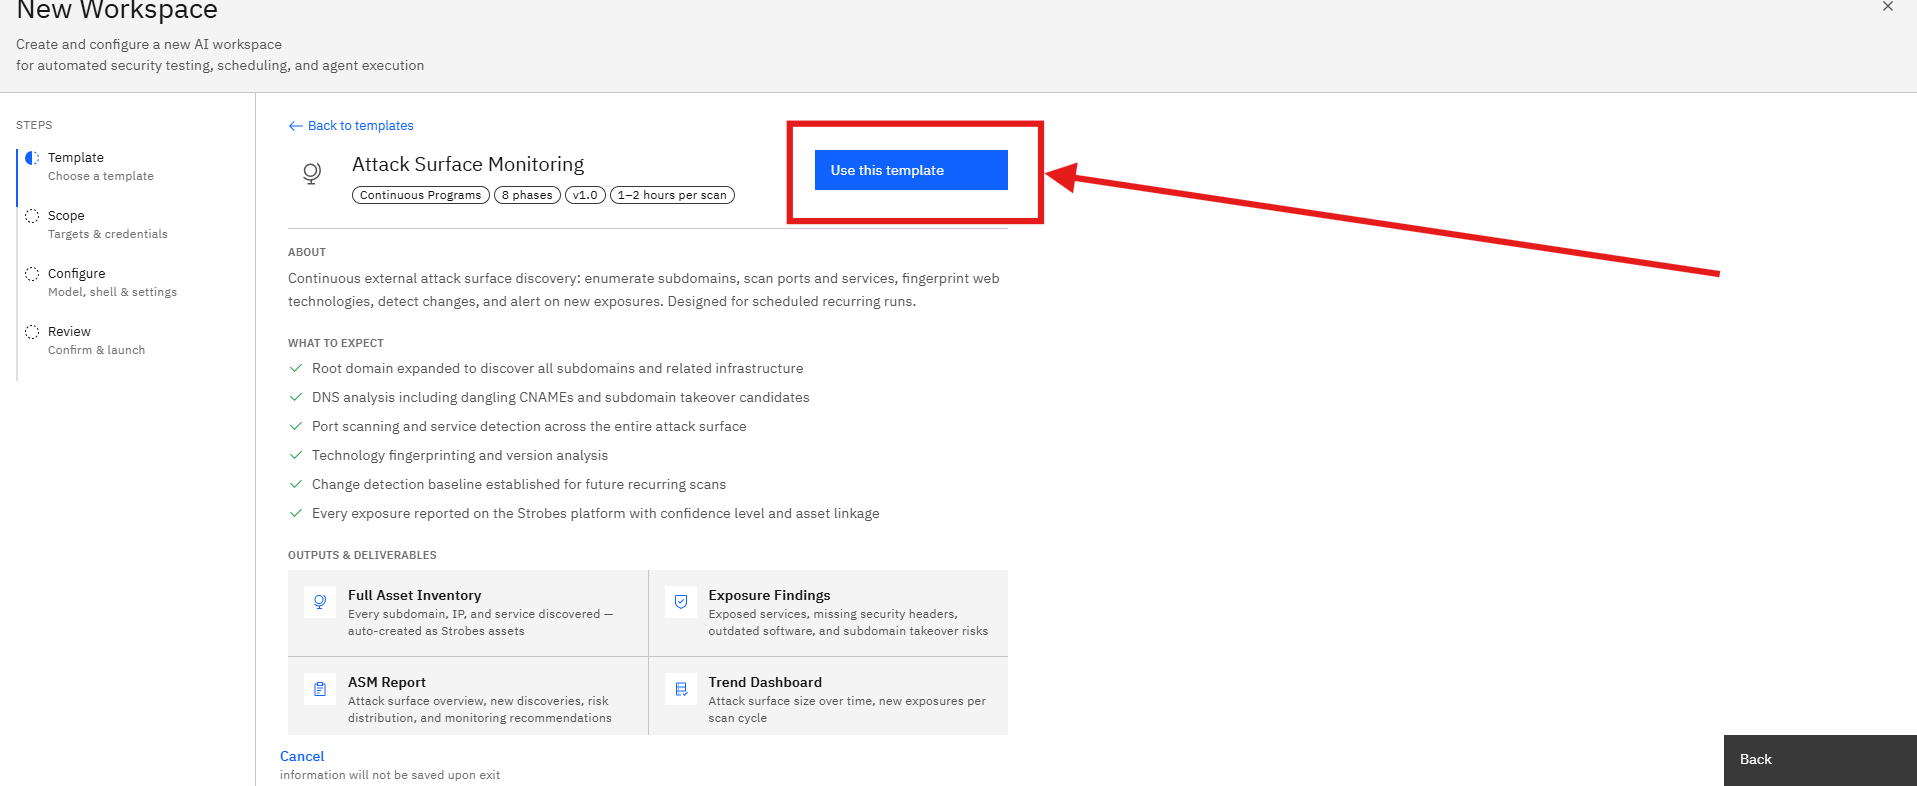
- What the Assessment Covers
- Deliverables
- Step 2: Enter the Workspace Name
- Step 3: Enter the Root Domain
- Step 4: Select Credentials (Optional)
- Step 5: Proceed to Configuration
- Step 6: Select an AI Model
- Step 7: Configure the Shell Environment
- Step 8: Configure the Browser Environment
- Step 9: Configure the Monitoring Schedule
- Daily Monitoring
- Weekly Deep Scan
- One-Time Discovery
- Step 10: Select an Execution Mode
- Autonomous
- Human-in-the-Loop
- Step 11: Configure Auto-Remediation (Optional)
- Step 12: Review the Assessment Configuration
- Workspace Details
- Scope Details
- Configuration
- Monitoring Settings
- Step 13: Launch the Monitoring Workspace
- Notes
The Attack Surface Monitoring template helps organizations continuously discover, inventory, and monitor internet-facing assets. The assessment identifies exposed services, subdomains, technologies, and potential security risks across your external attack surface.
The template is designed for continuous monitoring and can automatically detect newly exposed assets and changes to your external footprint.
Accessing the Attack Surface Monitoring Template
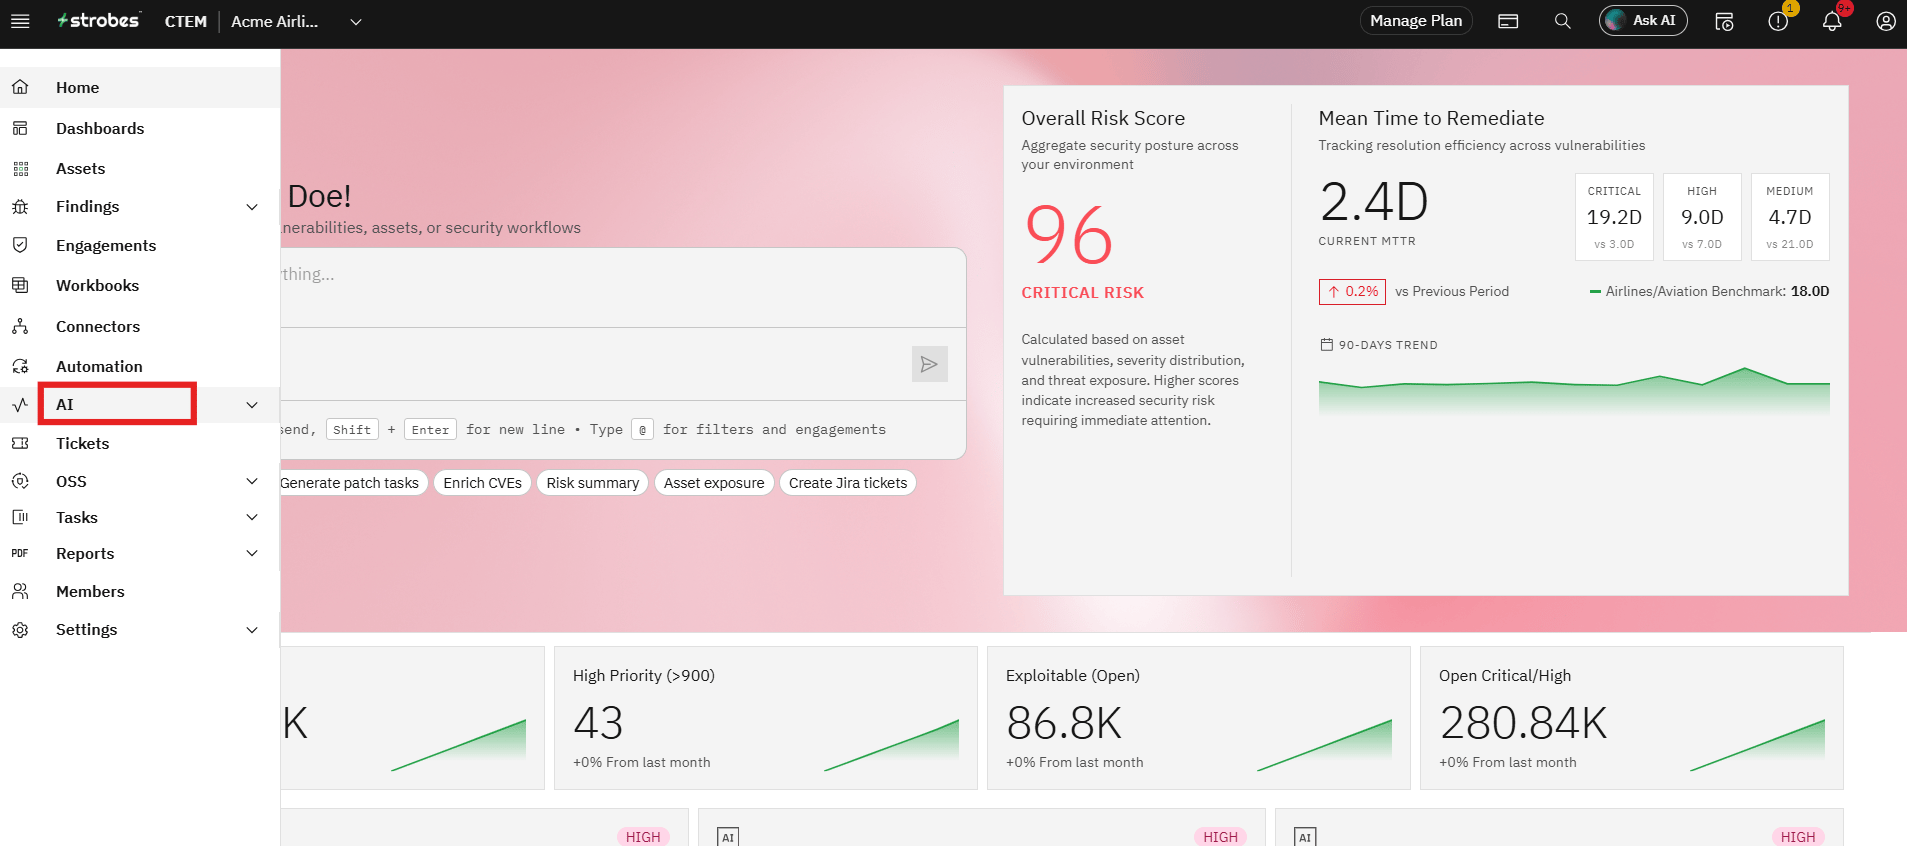
- Navigate to AI from the main navigation menu.
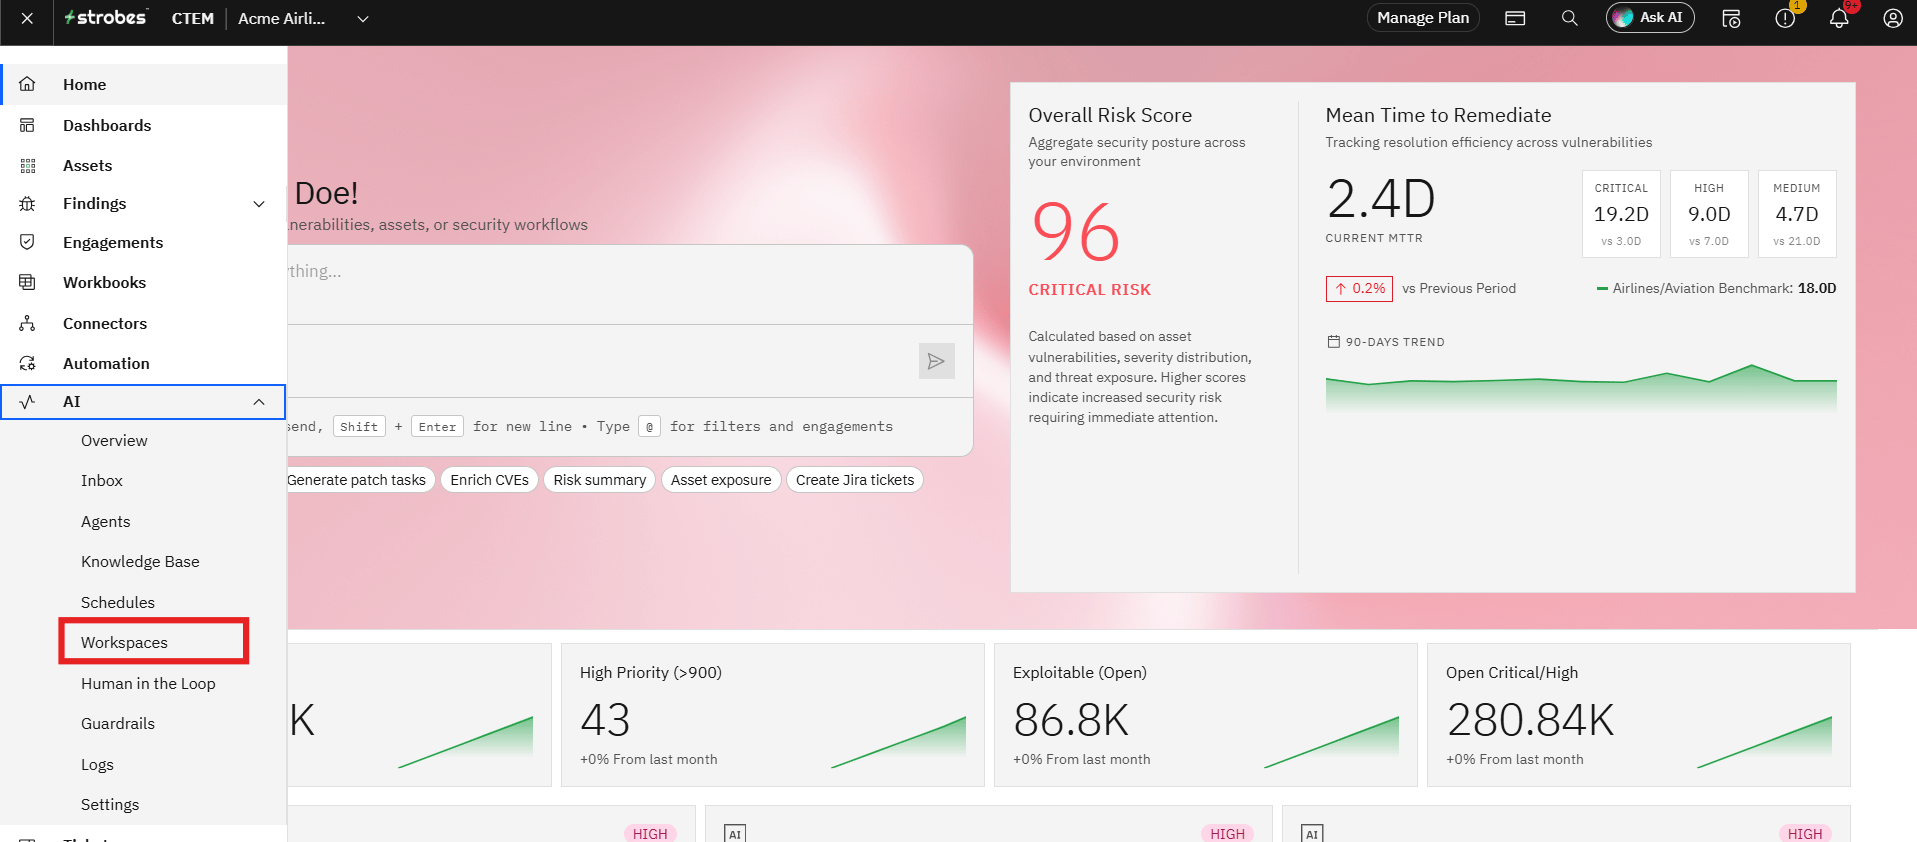
- Click Workspaces.
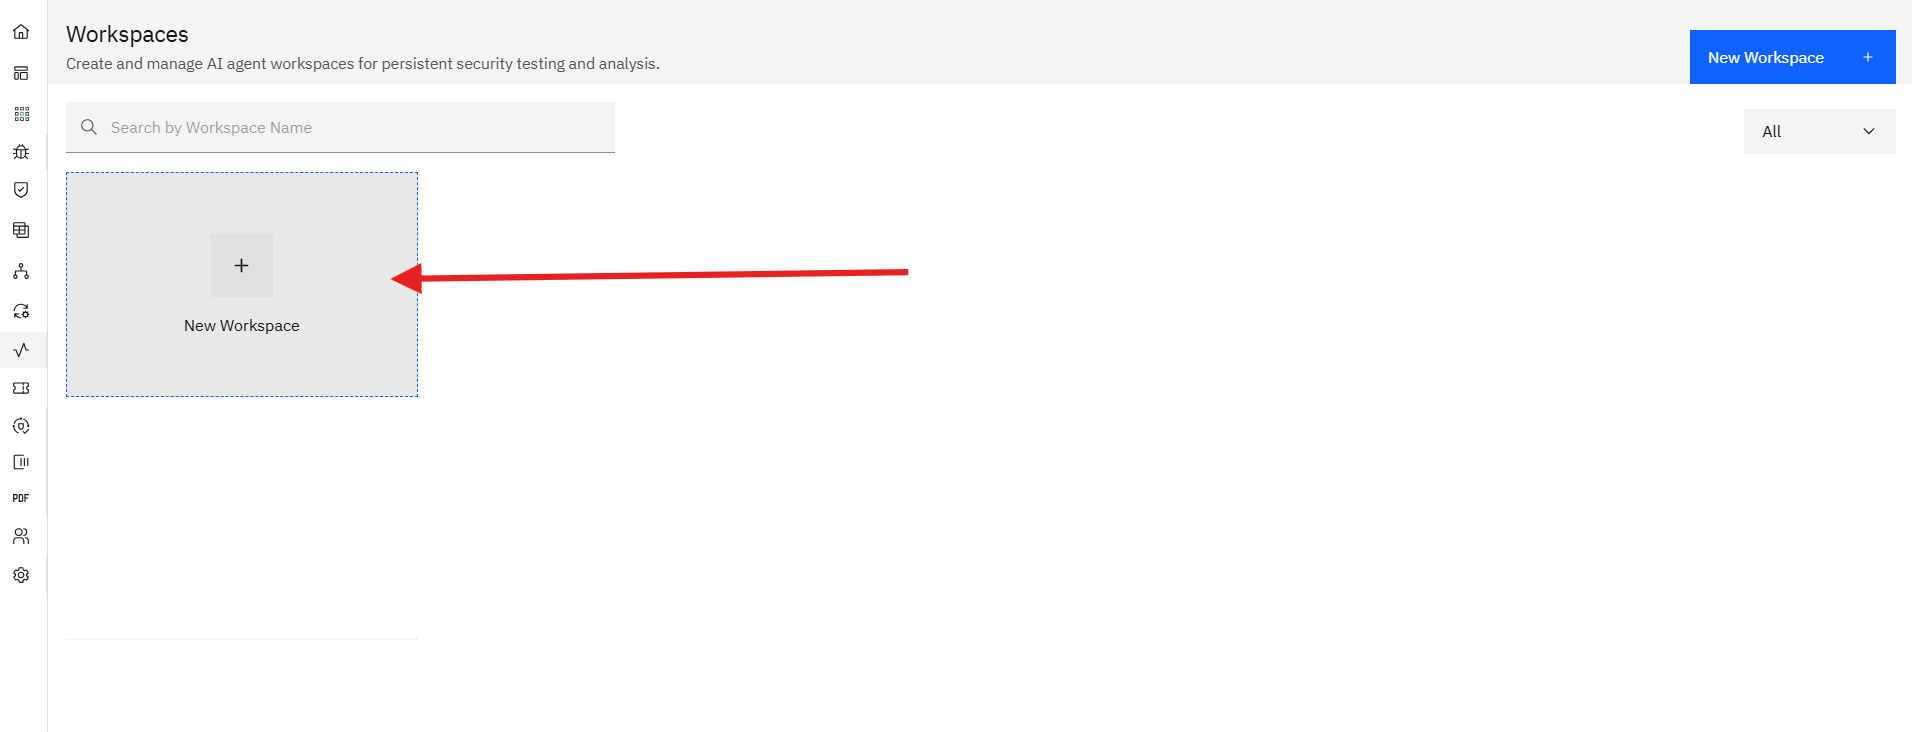
- Select New Workspace.
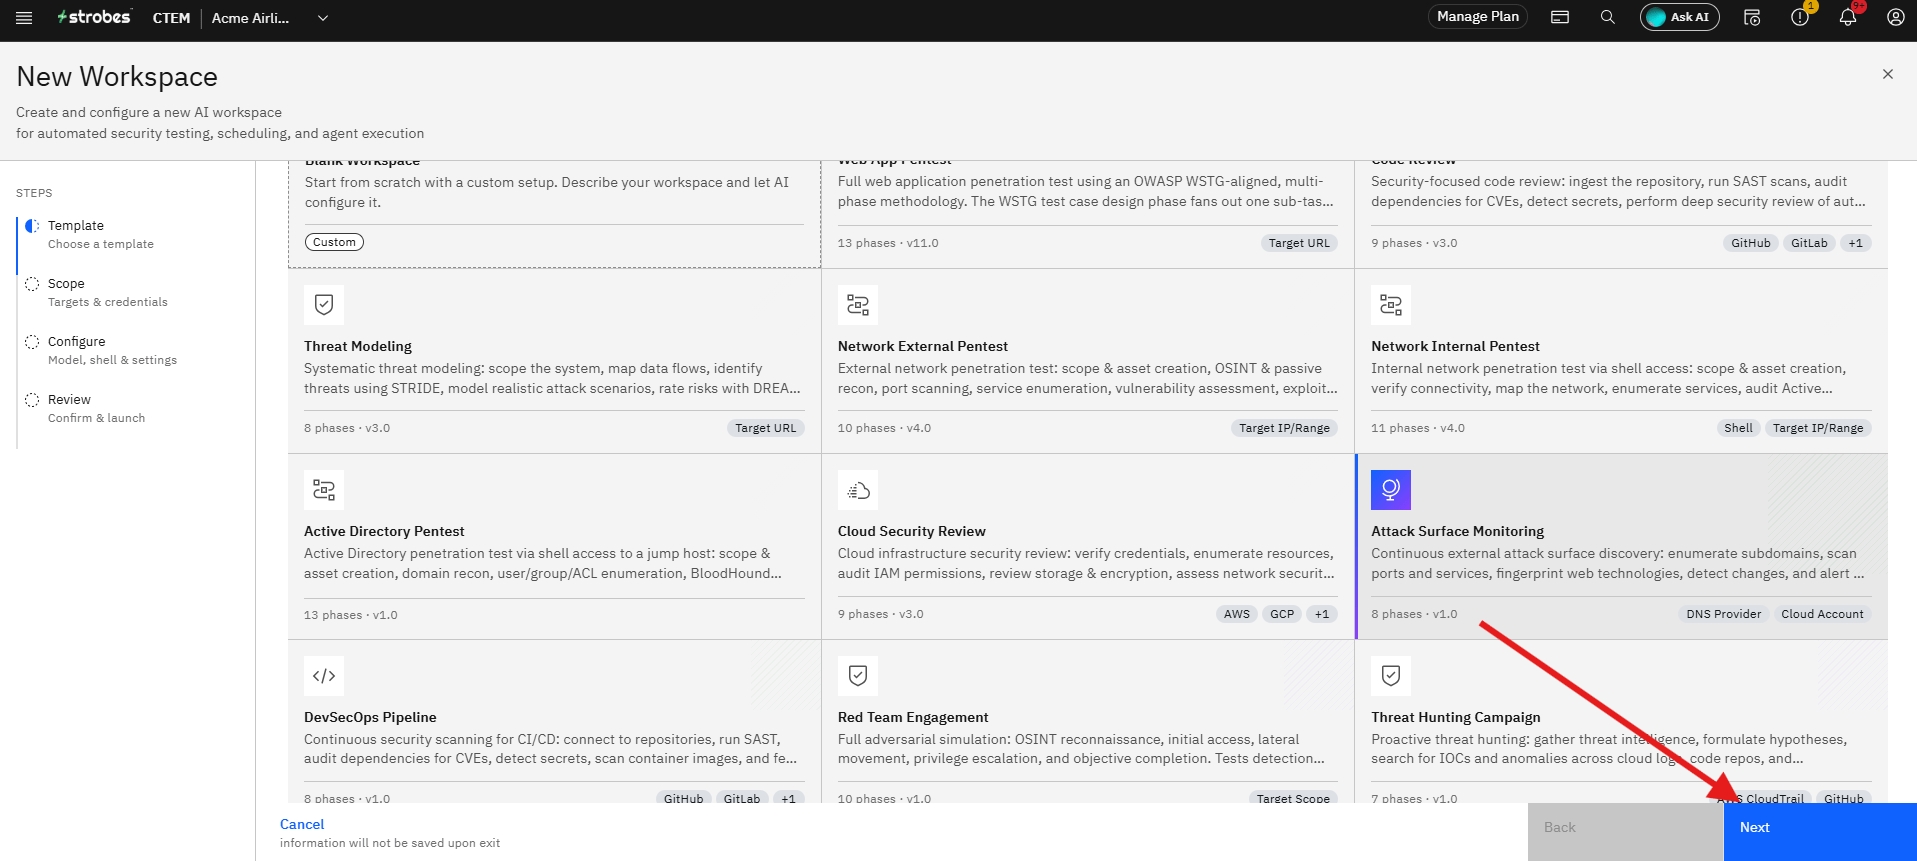
Step 1: Select the Attack Surface Monitoring Template
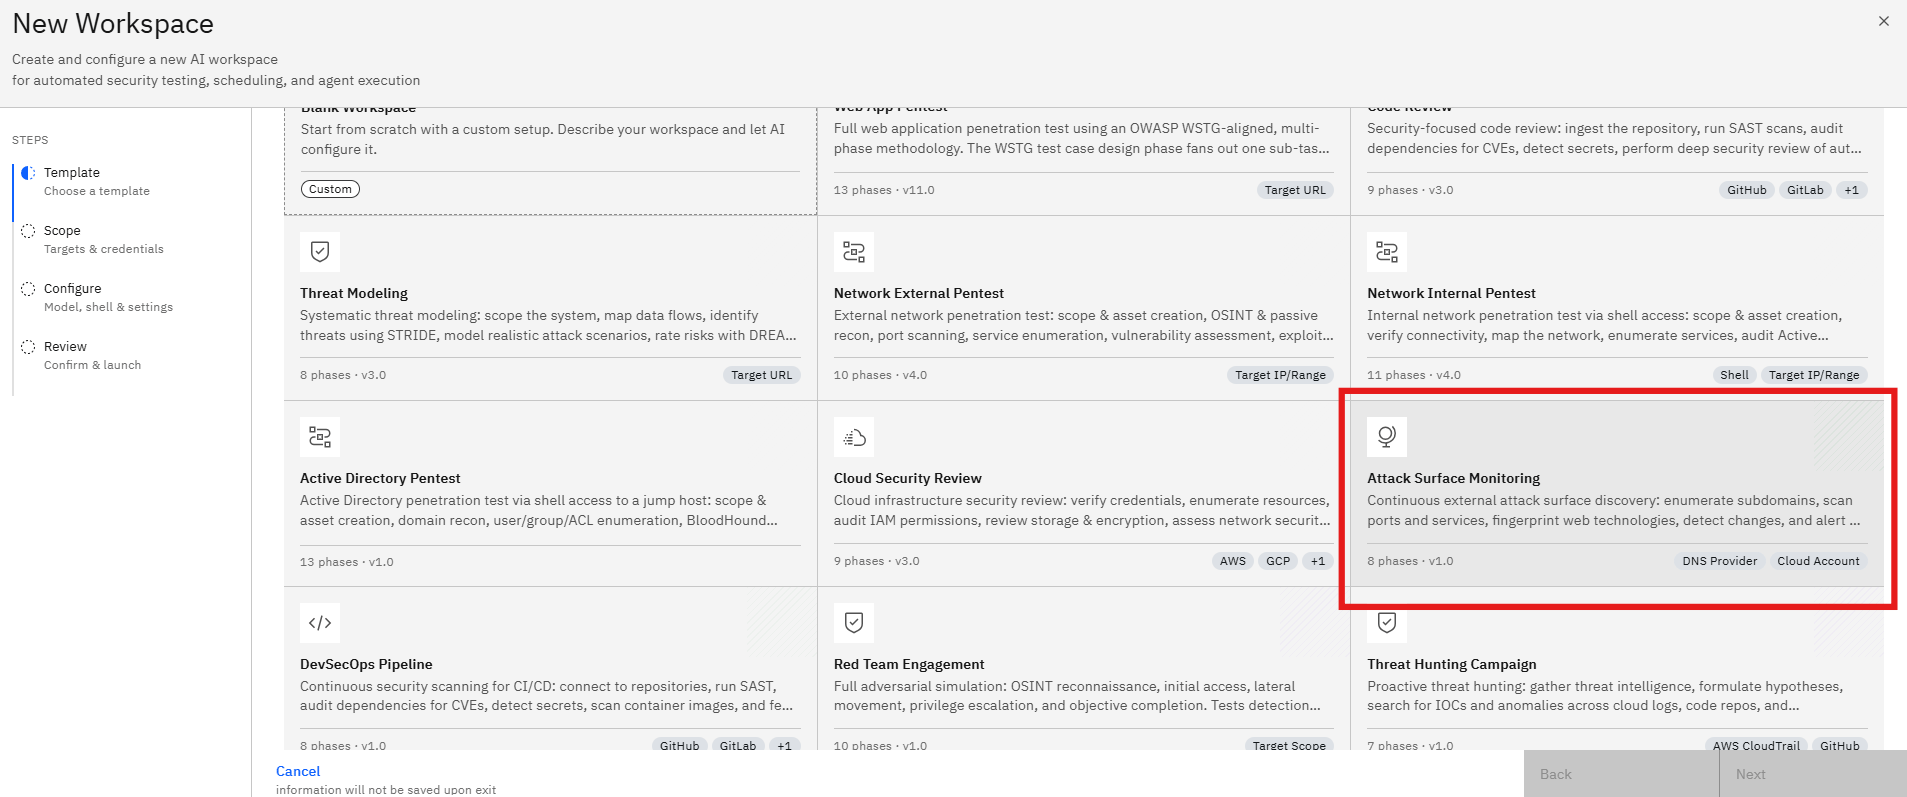
- Browse the available assessment templates.
- Locate Attack Surface Monitoring.
- Click the template card to review the assessment details.
What the Assessment Covers
The assessment typically performs:
- Subdomain discovery
- DNS enumeration
- Internet-facing asset discovery
- Service identification
- Technology fingerprinting
- Exposure monitoring
- Continuous attack surface tracking
Deliverables
The assessment generates:
- Asset Inventory
- Discovered Subdomains
- Exposed Services
- Technology Mapping
- Security Findings
- Exposure Reports
- Click Use this Template.
Step 2: Enter the Workspace Name
After selecting the template, the wizard moves to the Scope stage.
- Locate the Workspace Name field.
- Enter a descriptive name for the monitoring workspace.
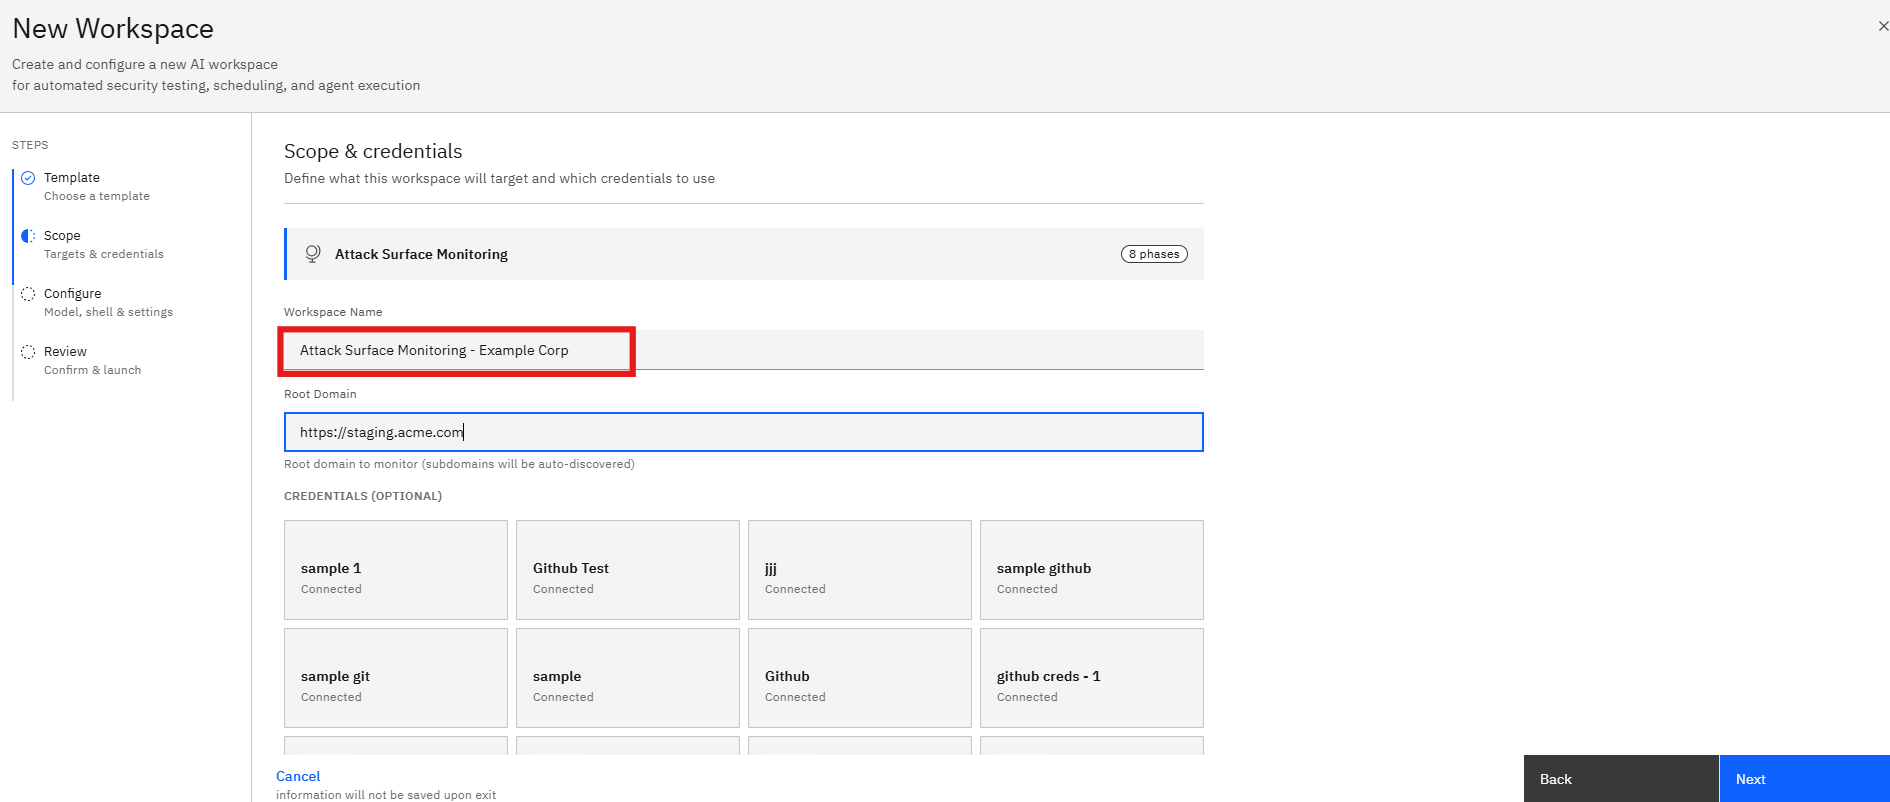
Using a meaningful workspace name helps identify monitoring activities across multiple environments.
Step 3: Enter the Root Domain
The Root Domain is the primary domain that will be monitored.
- Locate the Root Domain field.
- Enter the organization's primary domain.
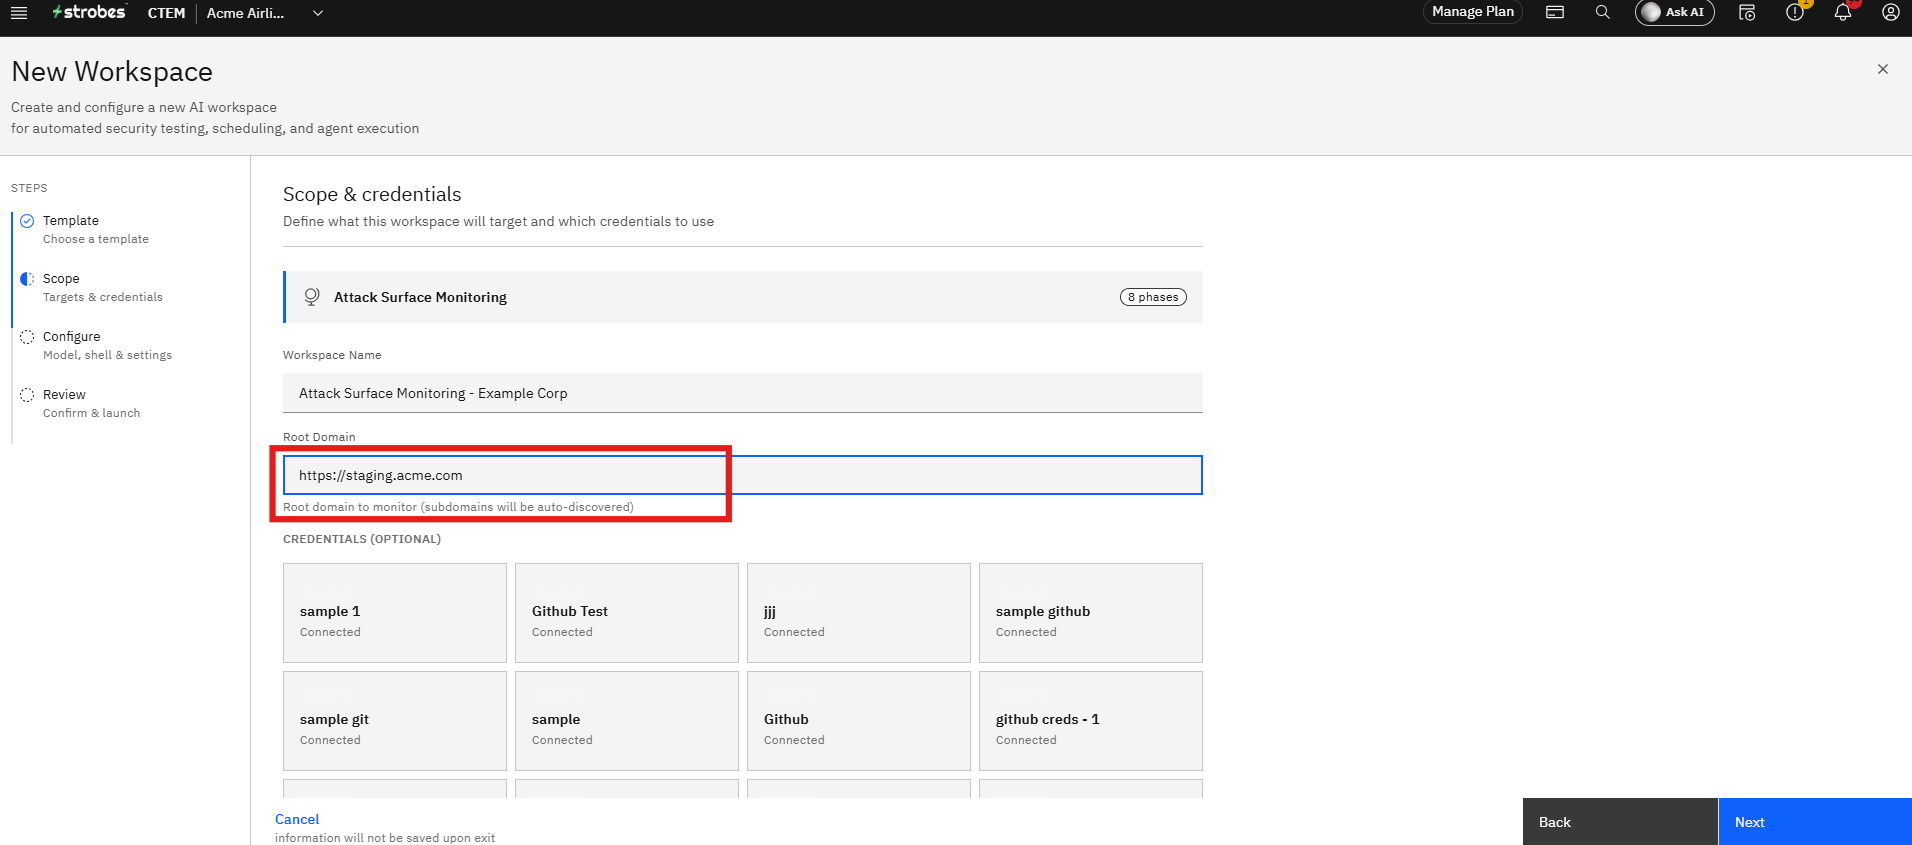
The platform uses this domain as the starting point for discovering external assets and subdomains.
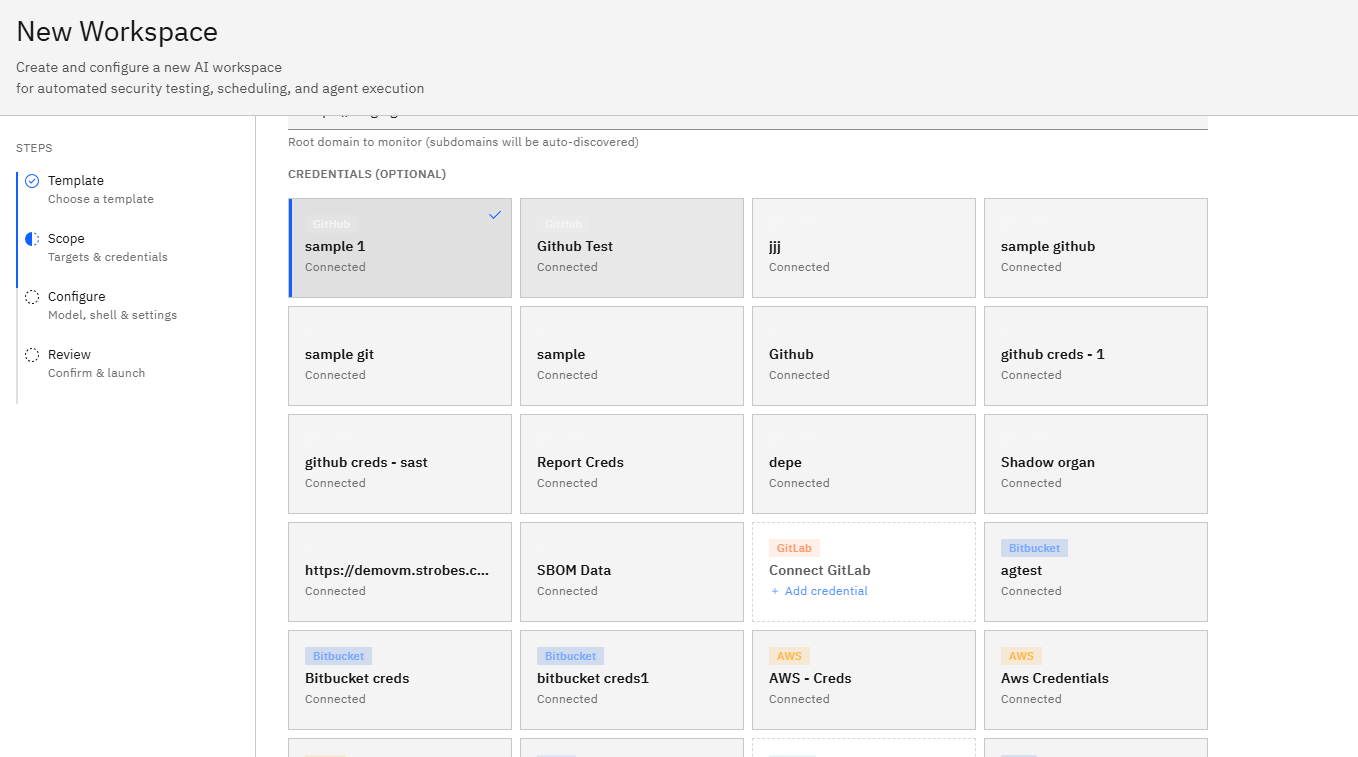
Step 4: Select Credentials (Optional)
Credentials can be used to enhance discovery and provide additional context during monitoring.
- Review the available credentials.
- Select any credentials relevant to the target organization.
Providing credentials may improve asset discovery and validation capabilities.
Step 5: Proceed to Configuration
After completing the scope details:
- Verify the workspace name.
- Confirm the root domain.
- Review any selected credentials.
- Click Next.
The wizard opens the Configure page.
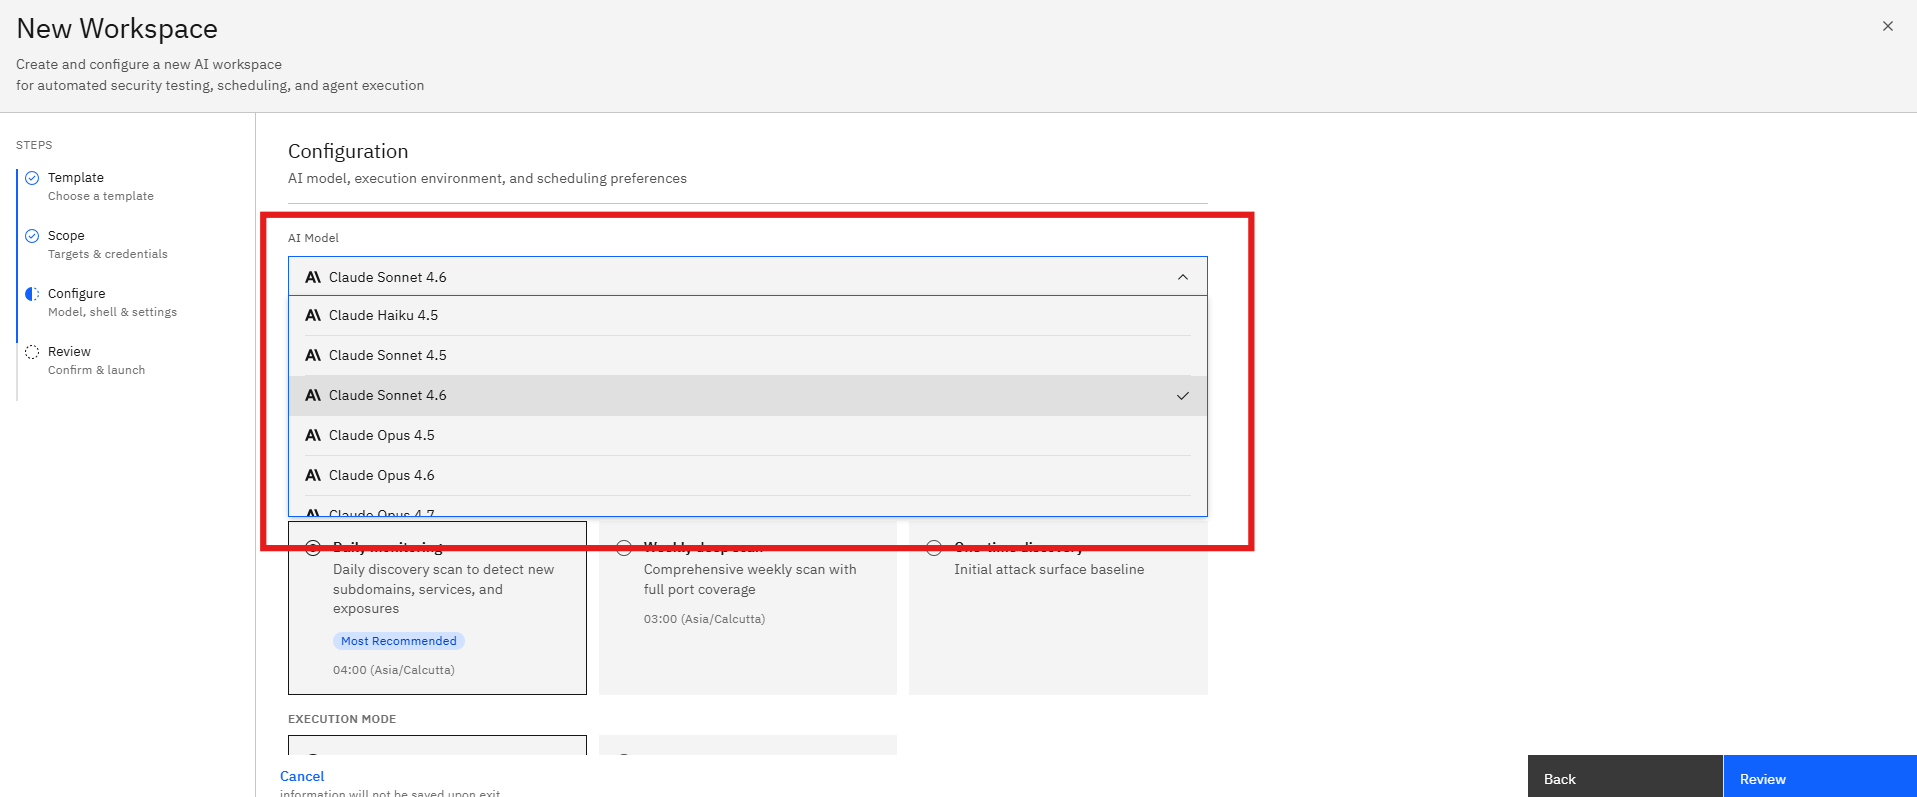
Step 6: Select an AI Model
The AI Model determines the reasoning engine used during asset analysis and risk evaluation.
- Open the Model dropdown.
- Review the available models.
- Select the model that best fits your monitoring requirements.
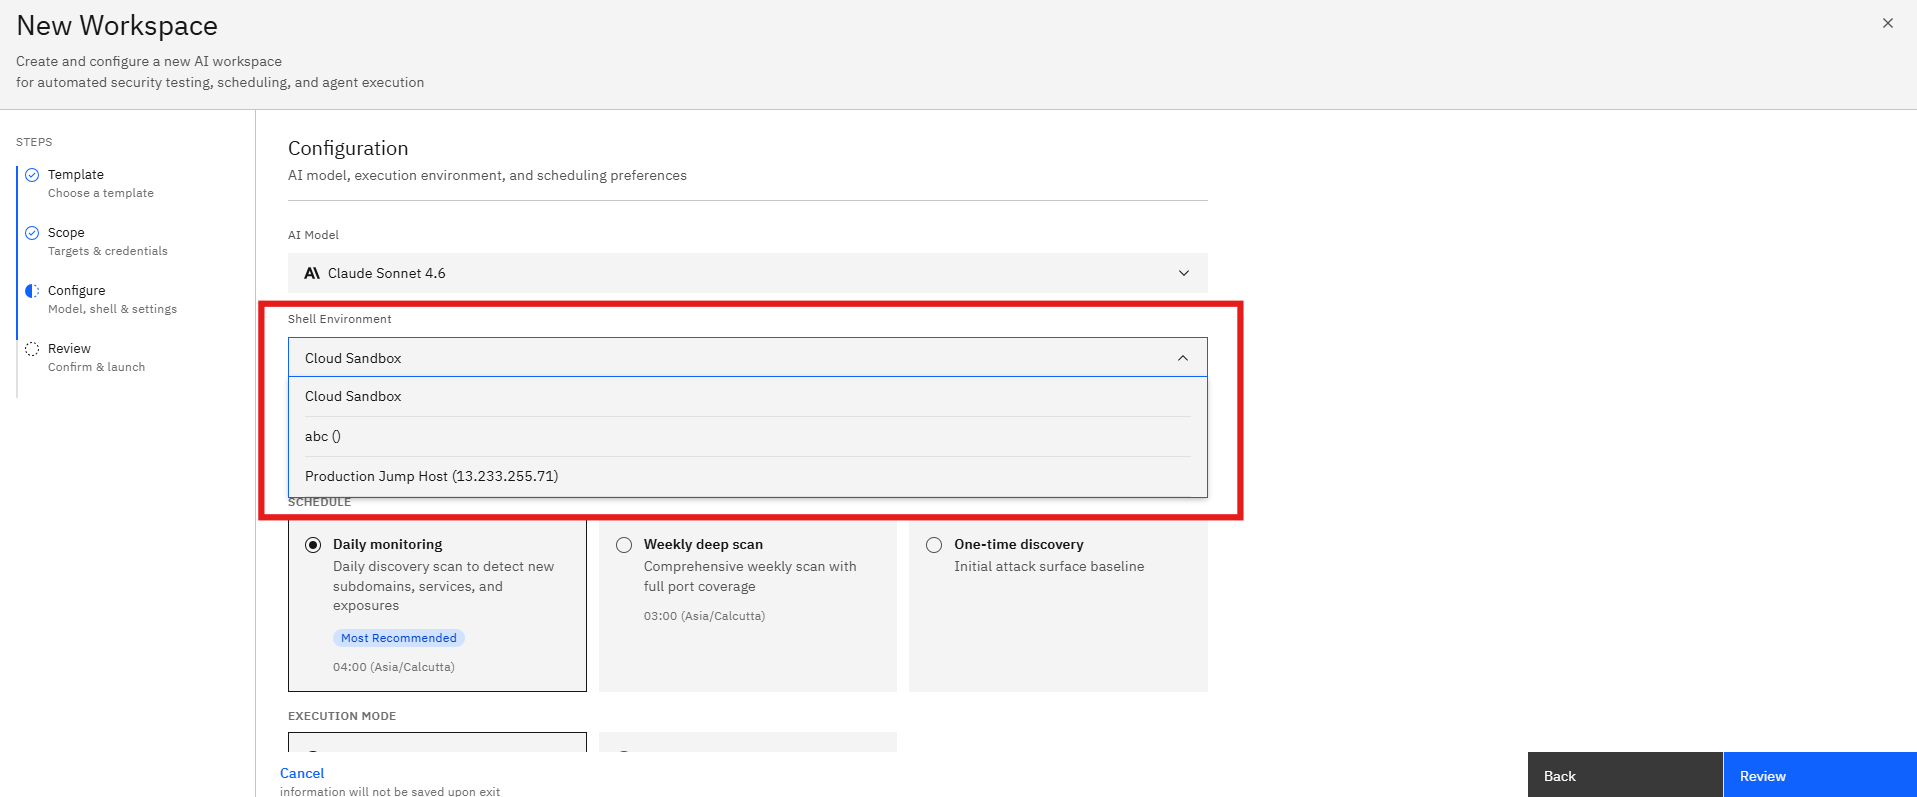
Step 7: Configure the Shell Environment
The Shell Environment defines where the AI agent executes monitoring activities.
- Open the Shell Environment dropdown.
- Select the desired environment.
The selected environment determines how the assessment performs discovery and analysis activities.
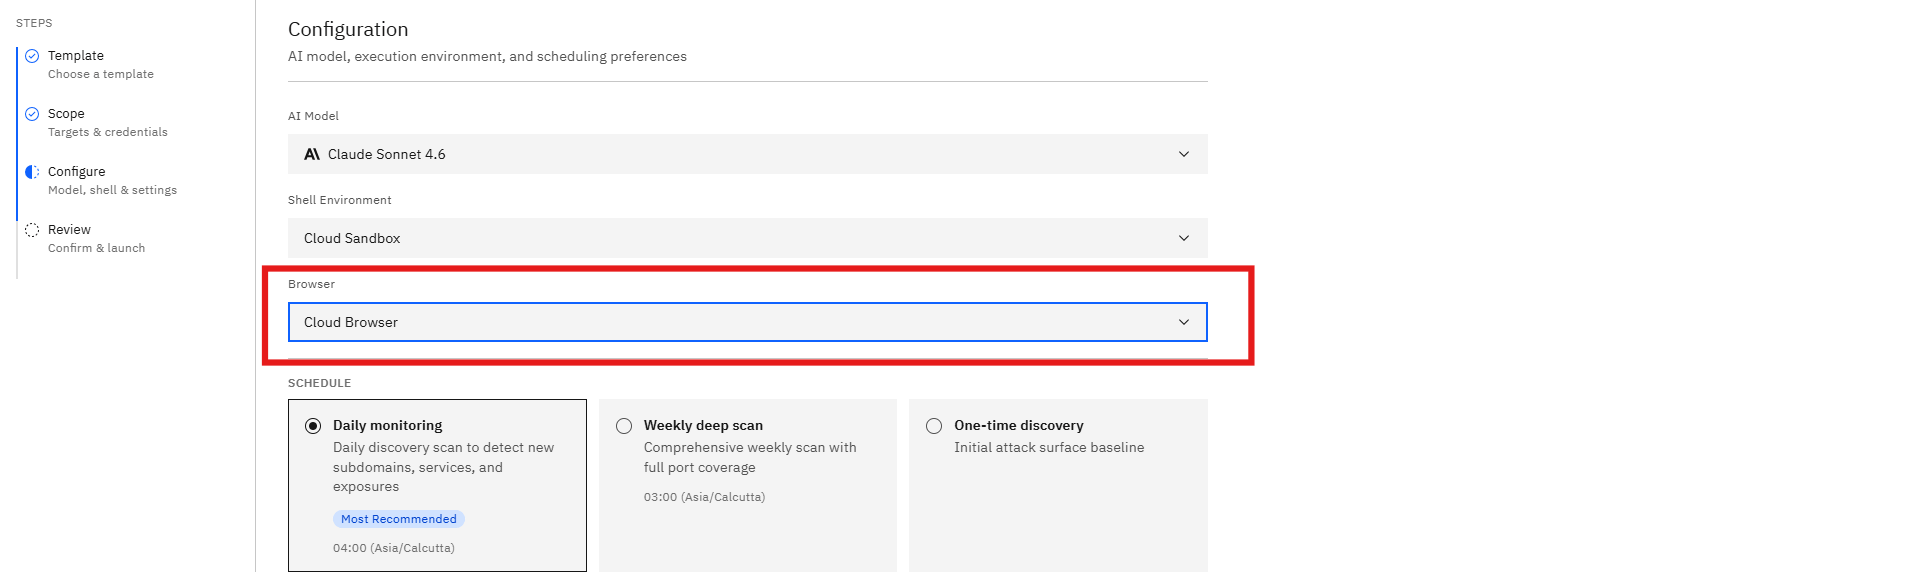
Step 8: Configure the Browser Environment
The Browser Environment enables web-based discovery and validation activities.
- Open the Browser dropdown.
- Select the preferred browser environment.
The browser environment assists with web asset validation and exposure analysis.
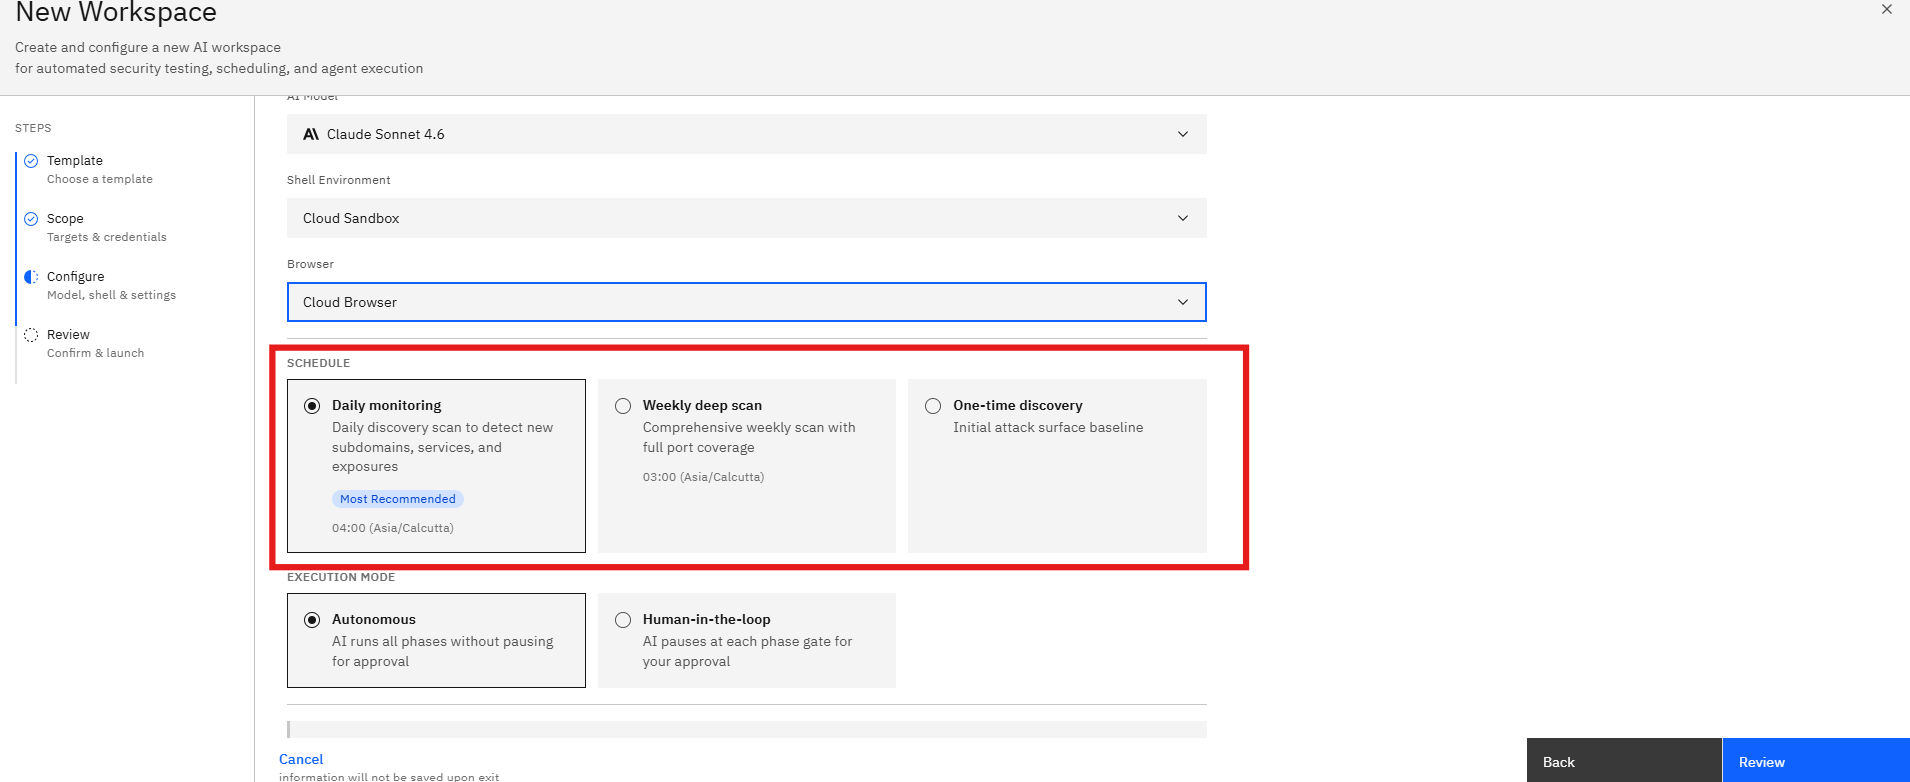
Step 9: Configure the Monitoring Schedule
Select how frequently the attack surface should be monitored.
Daily Monitoring
Daily discovery scans detect:
- New subdomains
- Newly exposed services
- Changes to internet-facing assets
This option is recommended for most organizations.
Weekly Deep Scan
Weekly deep scans perform:
- Comprehensive asset discovery
- Extended enumeration
- Broader service analysis
One-Time Discovery
Creates an initial attack surface baseline without recurring monitoring.
Use this option when:
- Performing an initial assessment
- Creating an asset inventory
- Conducting a point-in-time review
- Select the preferred schedule.
- Review the execution frequency.
Step 10: Select an Execution Mode
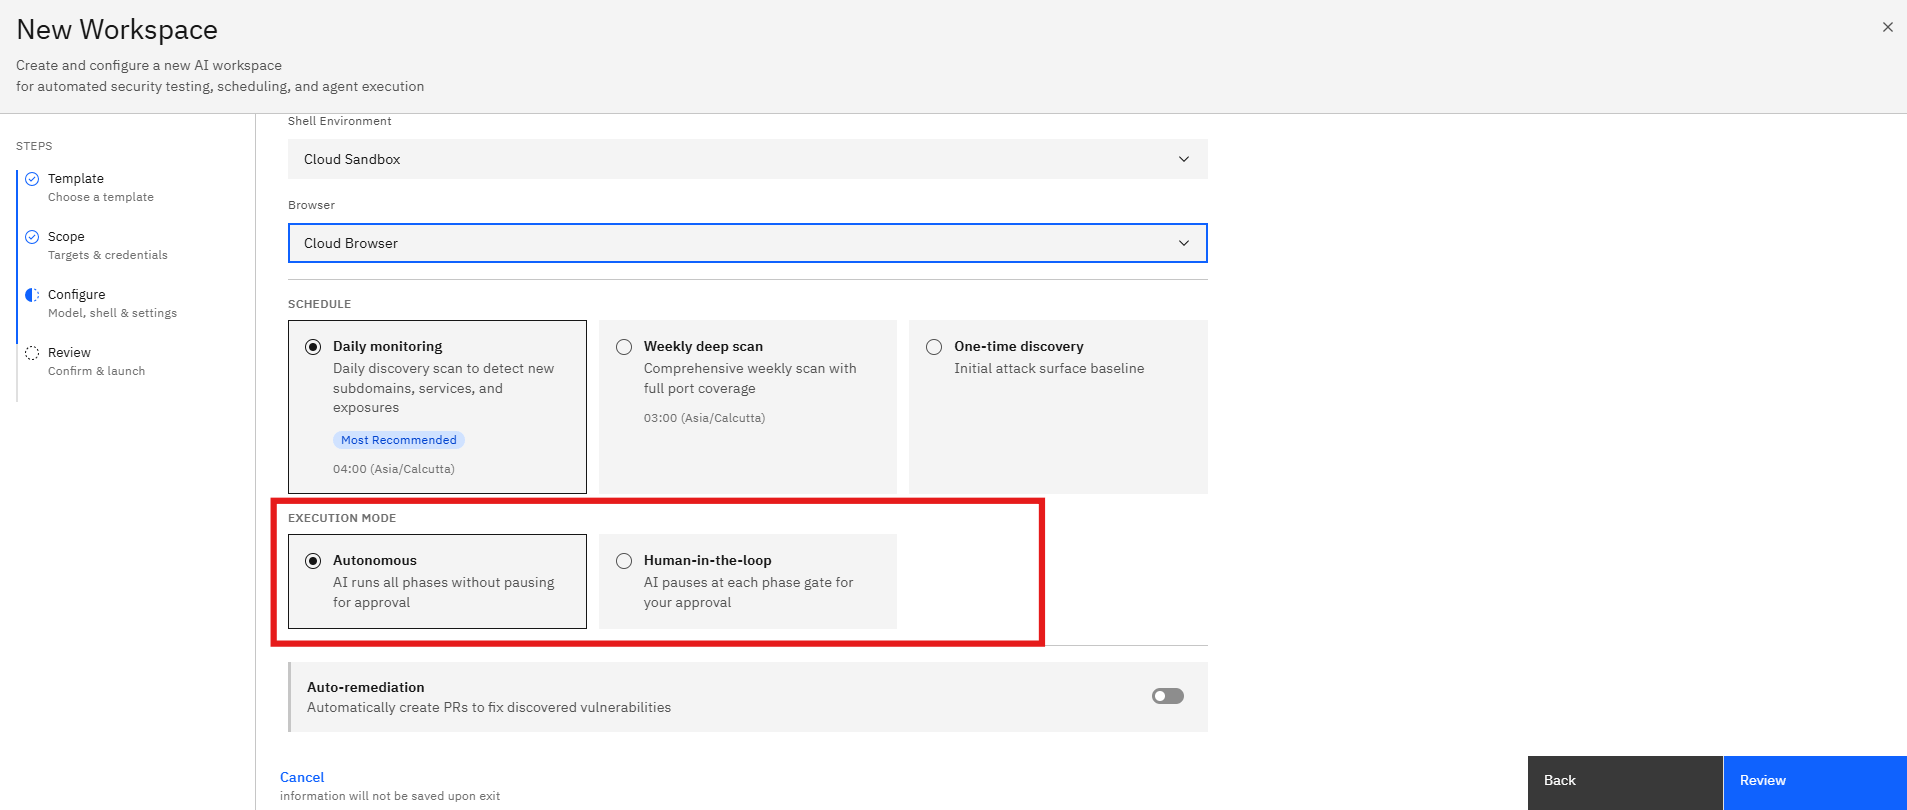
Choose how the AI agent progresses through the monitoring workflow.
Autonomous
The AI agent automatically completes all phases without requiring approval.
Recommended for:
- Continuous monitoring
- Automated discovery
- Recurring assessments
Human-in-the-Loop
The AI pauses at defined checkpoints and waits for user approval before continuing.
Recommended for:
- Controlled execution
- Manual validation
- Sensitive environments
- Select the desired execution mode.
- Review the workflow behavior.
Step 11: Configure Auto-Remediation (Optional)
Auto-remediation can automatically generate remediation actions when supported.
- Locate the Auto-remediation setting.
- Enable or disable the toggle as required.
When enabled, the platform may generate remediation recommendations and workflows for identified issues.
Step 12: Review the Assessment Configuration
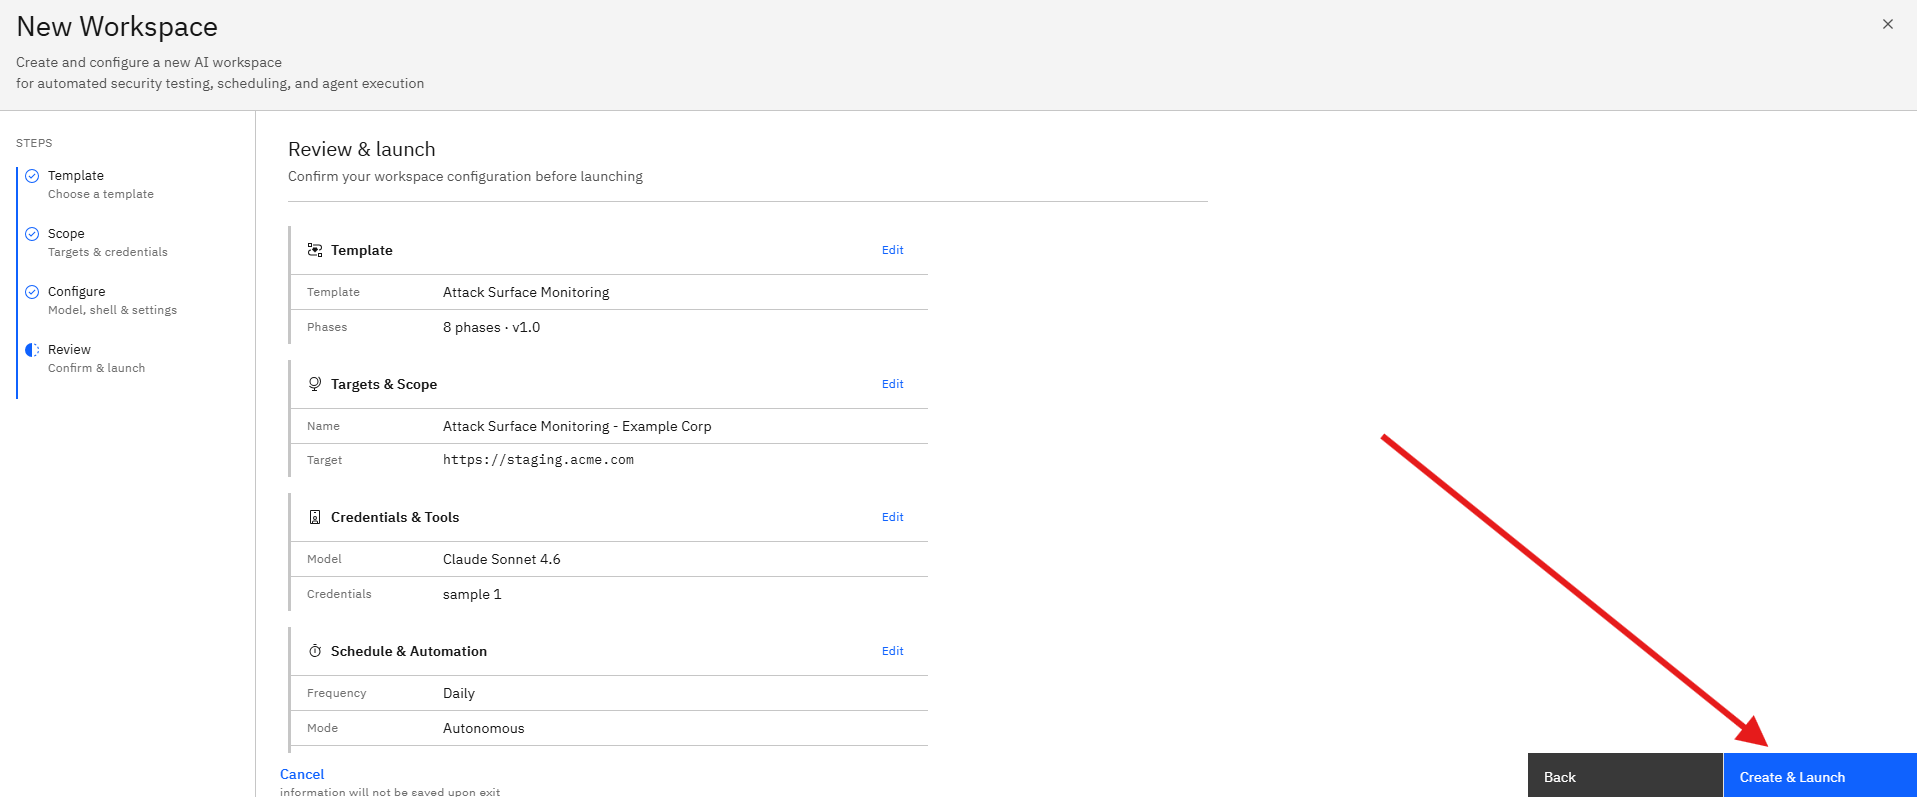
After completing the configuration, click Review.
The Review page displays:
Workspace Details
- Workspace Name
- Selected Template
Scope Details
- Root Domain
- Selected Credentials
Configuration
- AI Model
- Shell Environment
- Browser Environment
Monitoring Settings
- Schedule
- Execution Mode
- Auto-remediation Status
Carefully verify all settings before launching the monitoring workspace.
Step 13: Launch the Monitoring Workspace
Once all settings have been reviewed:
- Click Create & Launch.
- The workspace is created.
- Monitoring begins according to the selected schedule.
The platform will continuously:
- Discover new assets
- Monitor subdomains
- Identify exposed services
- Detect attack surface changes
- Generate findings and recommendations
Notes
- Ensure the root domain is entered correctly before launching the assessment.
- Daily Monitoring is recommended for organizations with frequently changing infrastructure.
- Weekly Deep Scans provide broader visibility across external assets.
- Human-in-the-Loop mode offers additional control over monitoring workflows.
- Auto-remediation should be reviewed before enabling in production environments.
More in Pentest templates
Was this page helpful?