
Understanding the Findings Toolbar
2 min readEdit
On this page⌄
The Findings Management page in Strobes provides a centralized interface for managing and monitoring findings identified across your environment. It is built on a feature-rich data grid, allowing security teams to efficiently view, analyze, filter, and manage large volumes of finding data from a single location.
The Findings Management page can be used by security teams to get a consolidated view of their security posture, focus on the most critical risks, and efficiently track findings from identification through remediation.
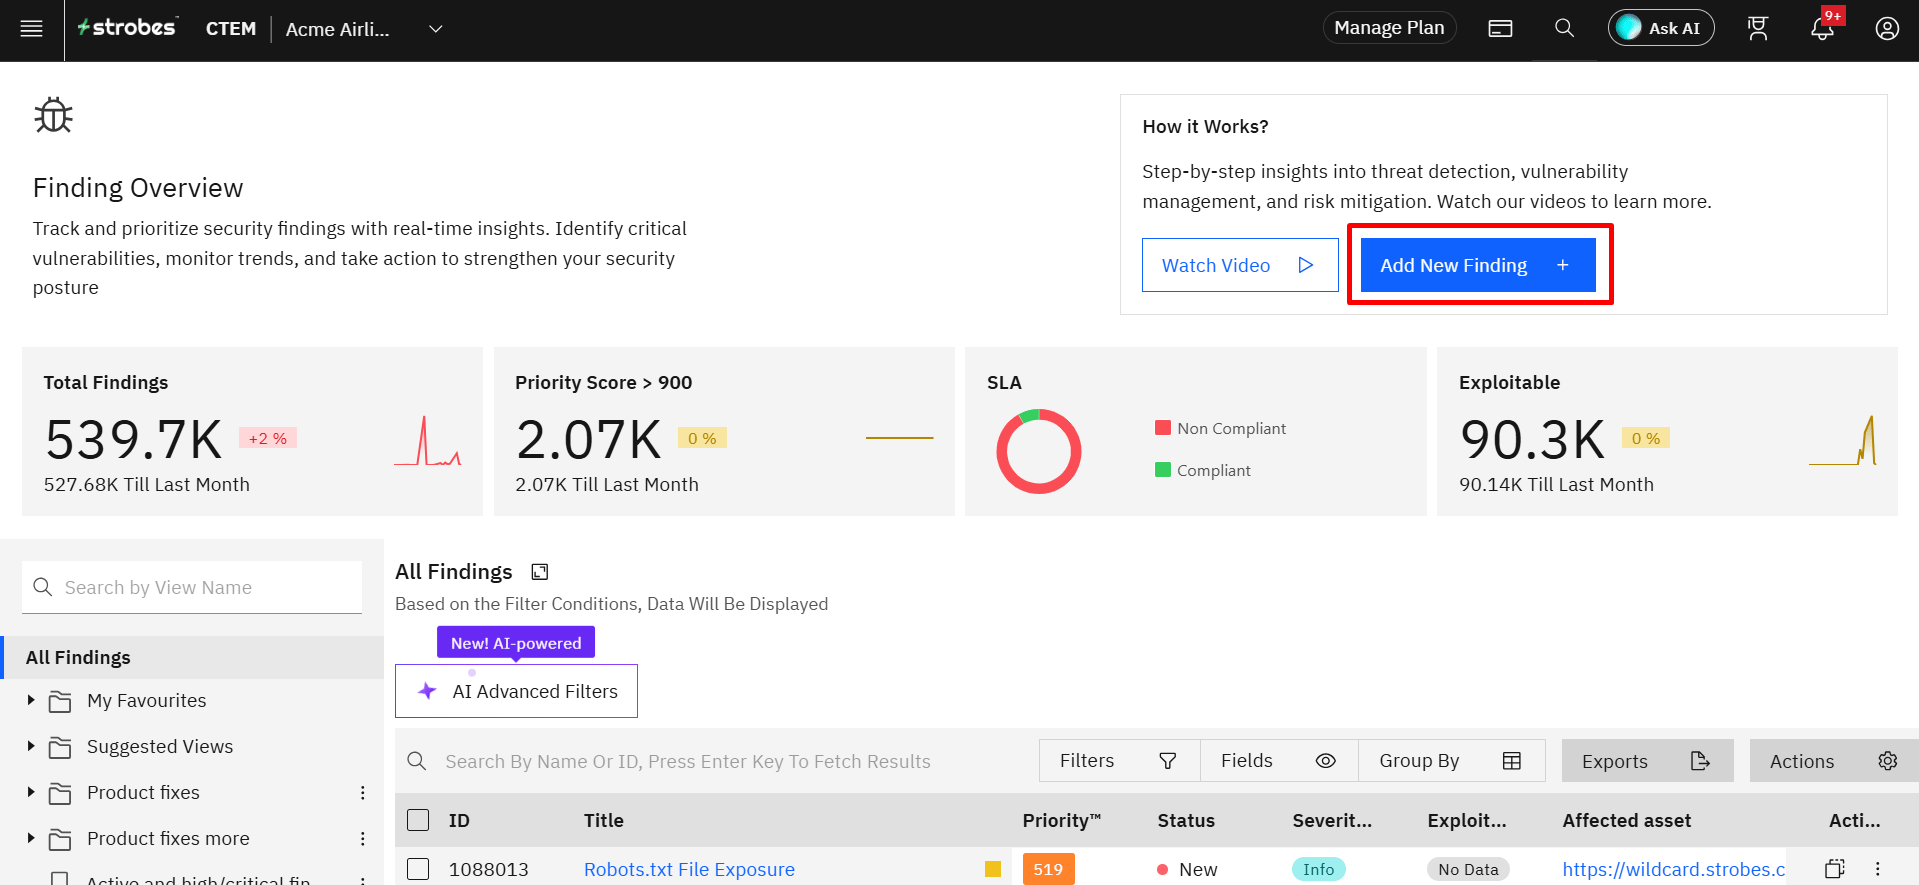
The following screenshot highlights the toolbar on the Finding Management page.
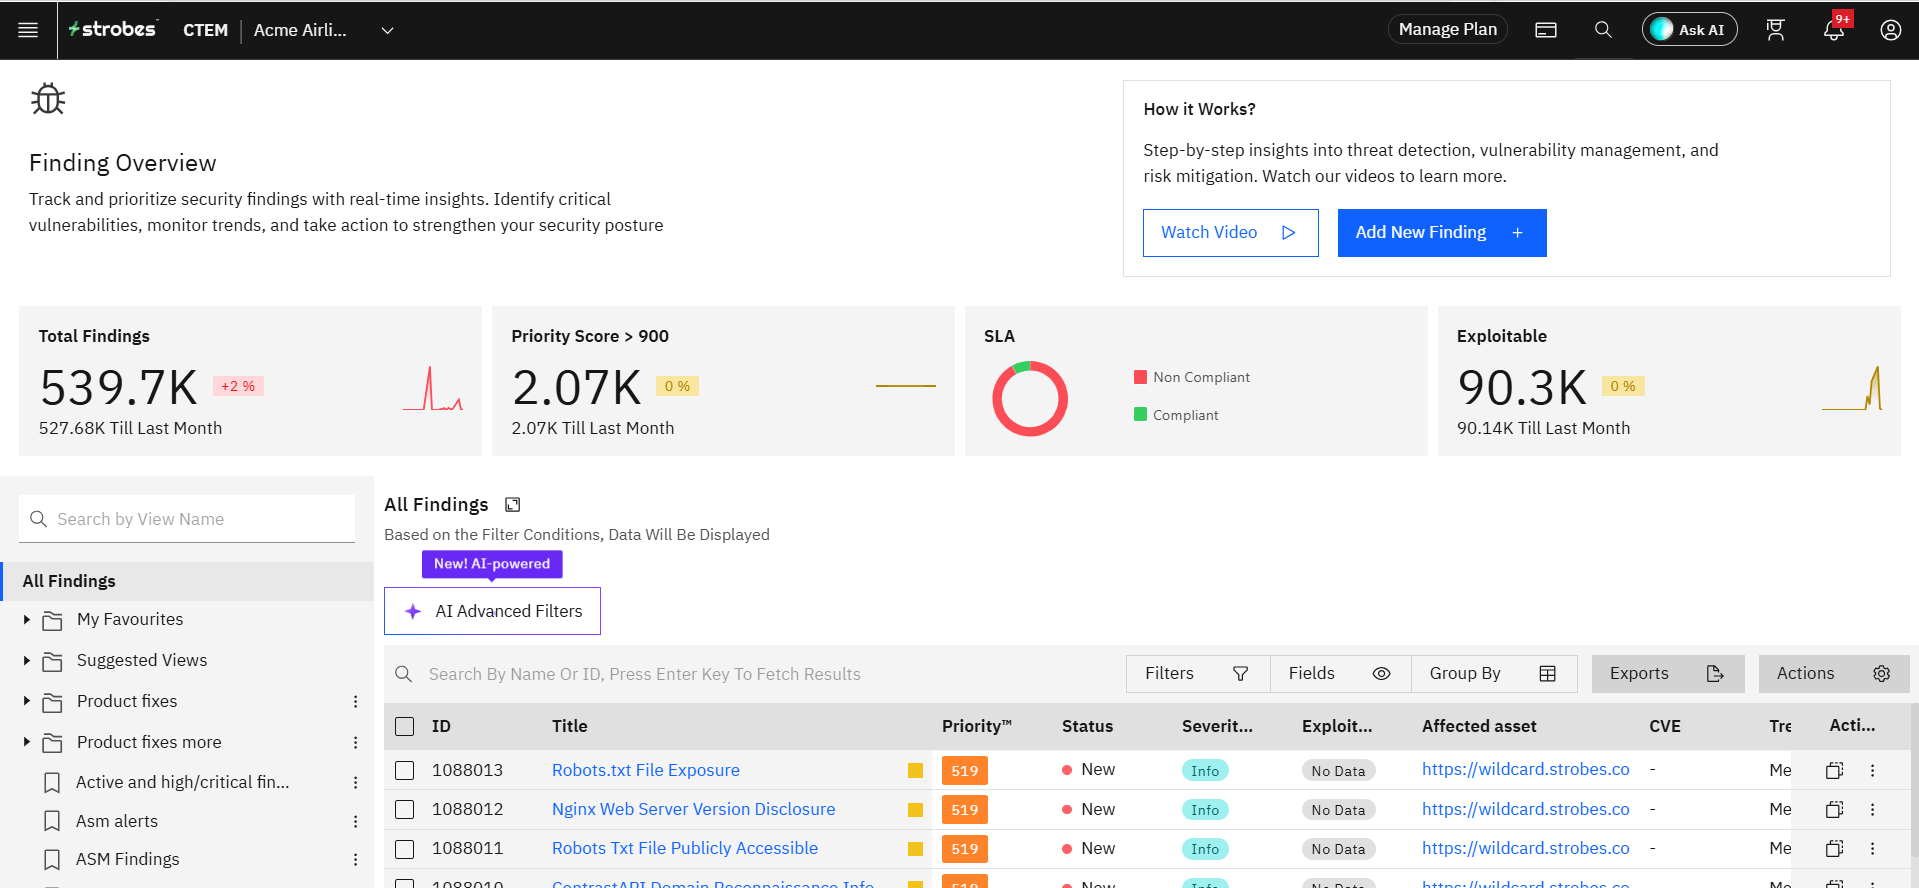
The toolbar consists of the following options:
- Views
- Fields
- Filters
- Sort by
- Row size
- Actions
- Search
- New Finding
Now, let's take a look at each of these options.
Views
About Views
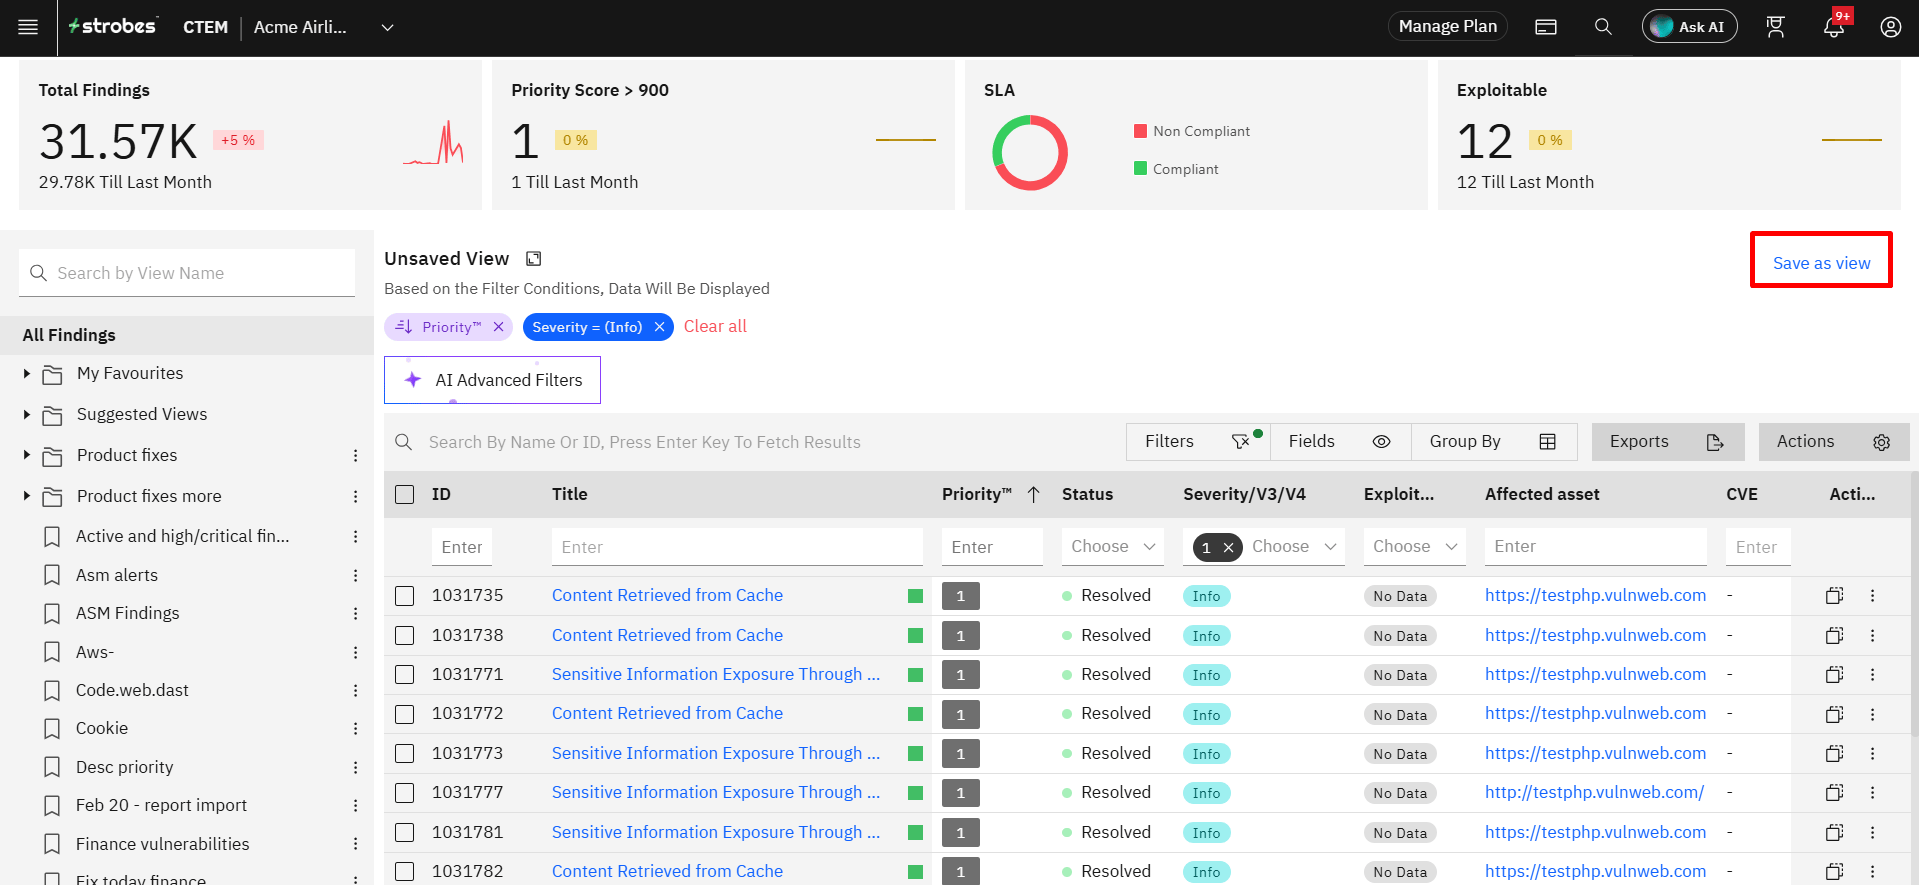
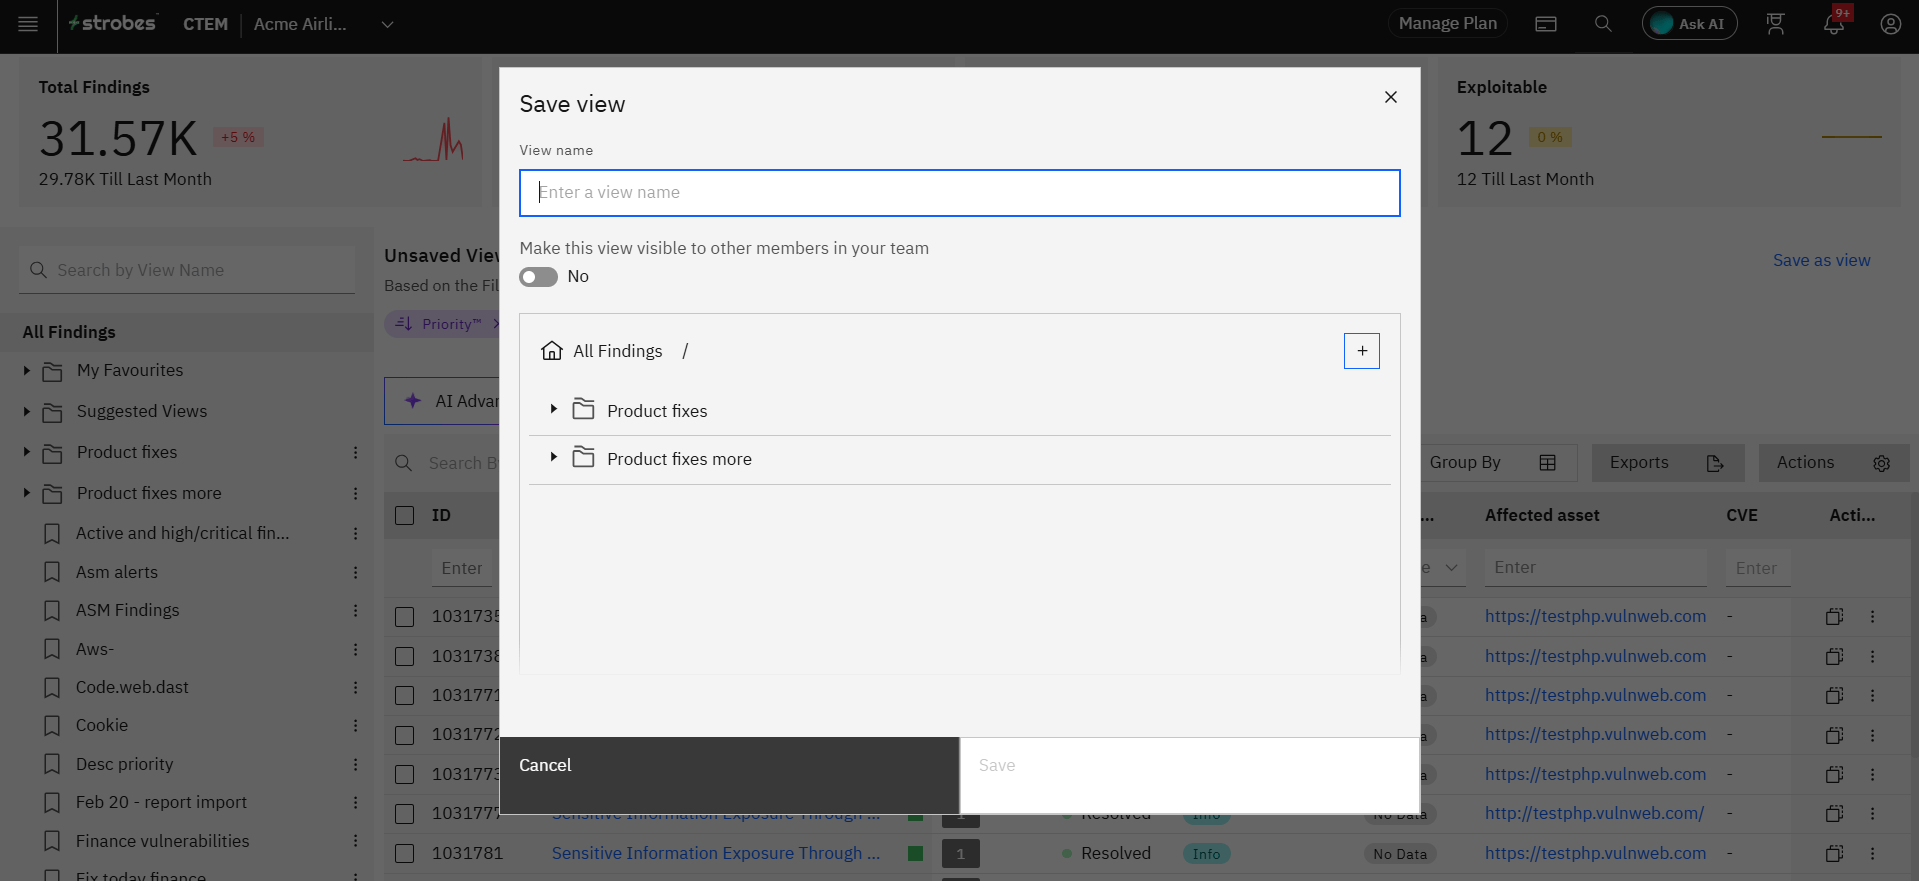
Views allow you to store a combination of configurations belonging to Fields, Filters, and Sort by options to give you one-click access. The views are not sharable and user-specific. You can toggle the view panel by clicking on the Views button in the toolbar.
How to Save View
To save a View, toggle the required fields that you would like to see, apply your filters and add sort conditions.
Then click on Save current view at the bottom left and give it a name.
Suggested Views
Strobes provide you with intelligent view suggestions that help you access the following in one click:
- Web Findings
- Mobile Findings
- Network Findings
- Cloud Findings
- Exploitable Findings
- SLA Violated Findings
- Highest Priority Findings
- Active and High Priority Findings and many more
Fields
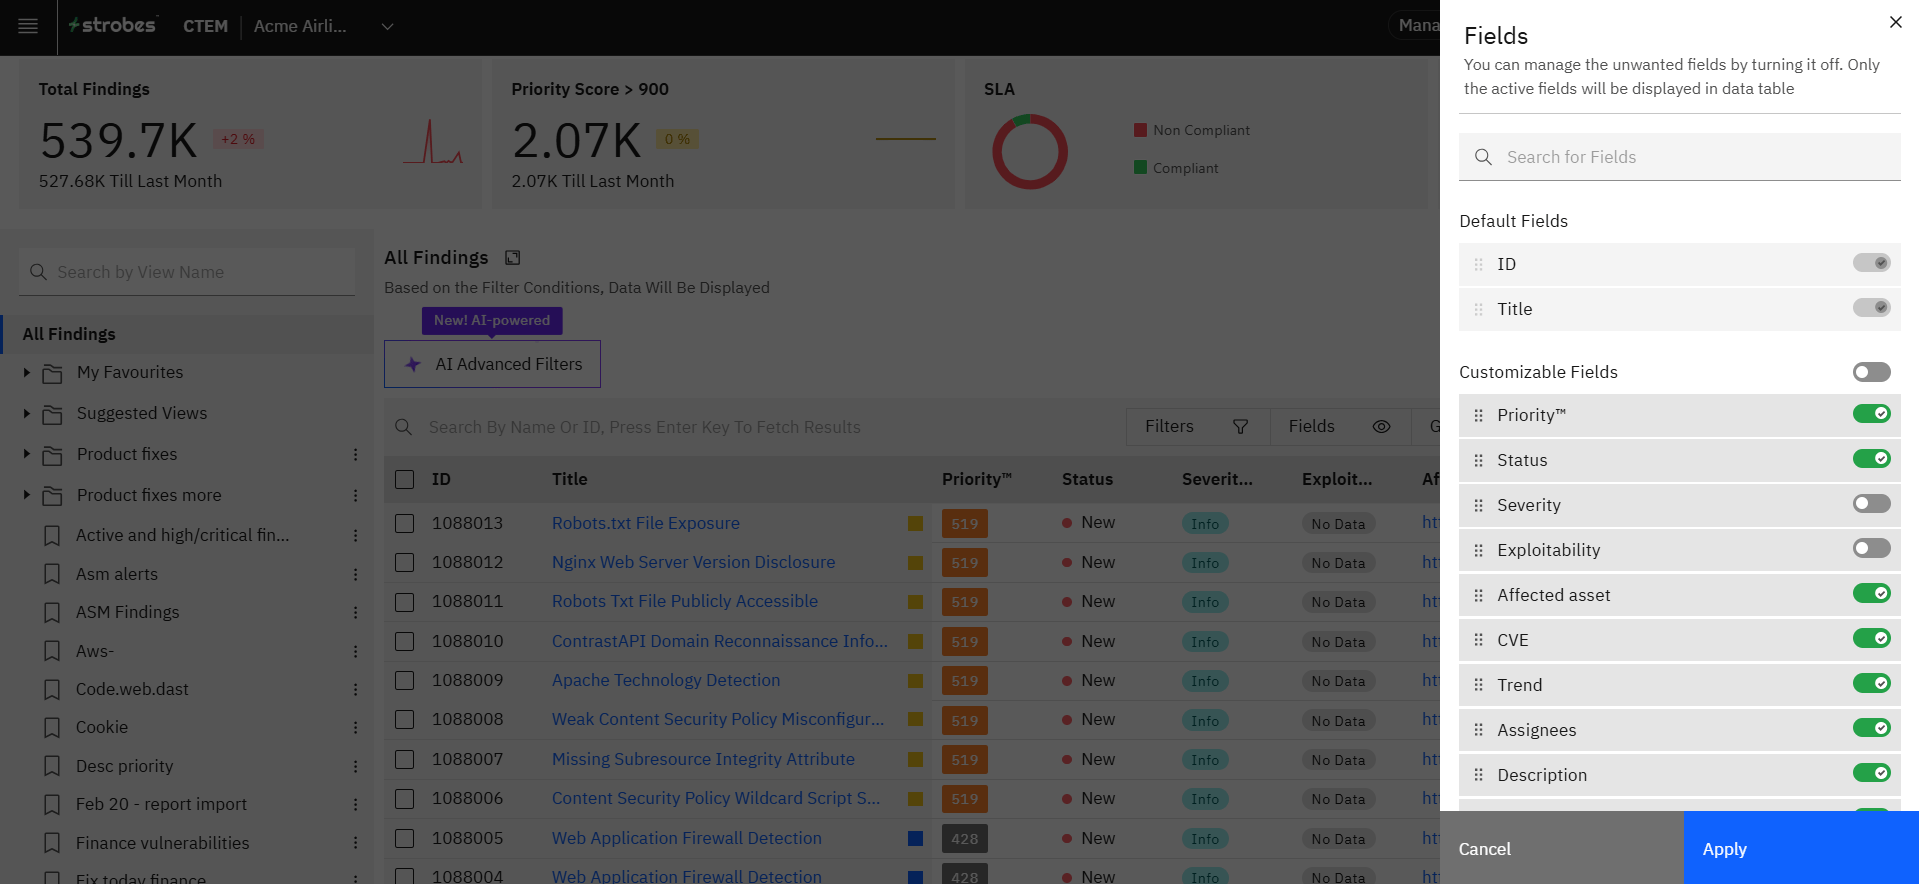
Fields are the columns in the datable. You get to choose which of the fields you want to consume while doing finding management.
Click on the Fields button in the toolbar, toggle the required fields and click Apply to load the result.
Filters
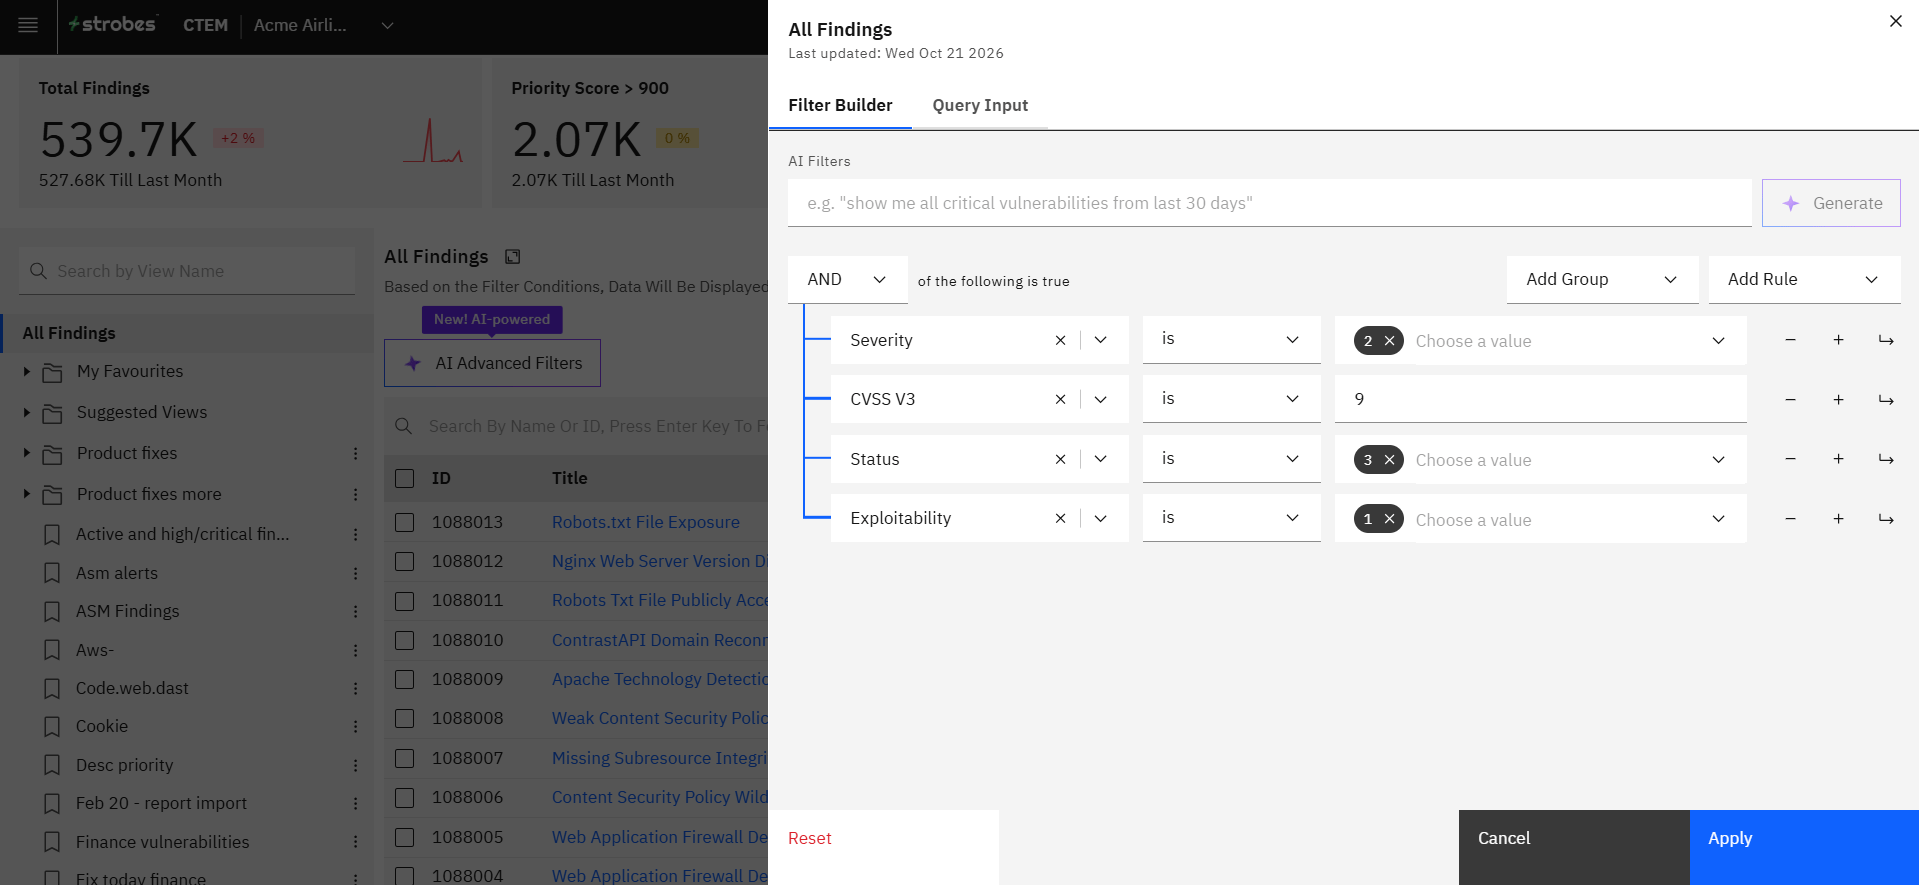
Filters in Strobes are the most powerful of all and are powered by graphql. You can query the findings based on multiple conditions. In this example, I am able to apply muliptle conditions that helped me narrow down the results as my priority is fix the top critical findings immediately.
Sort by
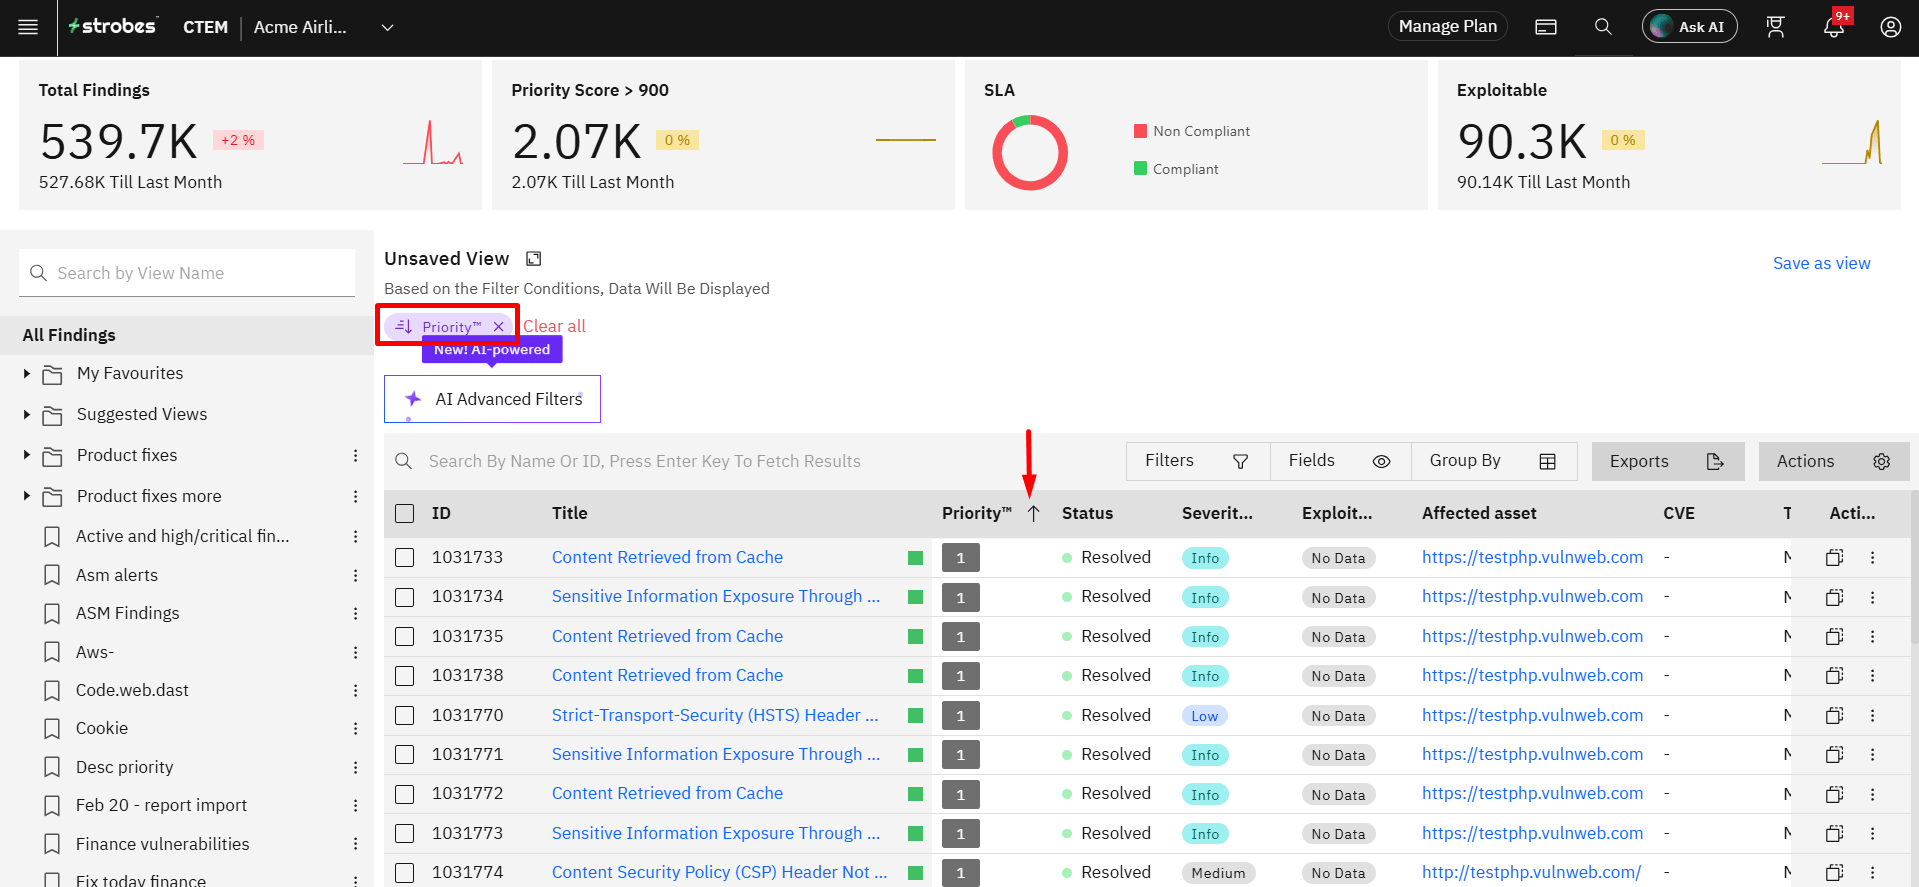
You can apply multiple sort conditions on the results and load them as you like.
Row size
You can customize how the height of the rows in the datatable. Based on the available space, the content is displayed.
Actions
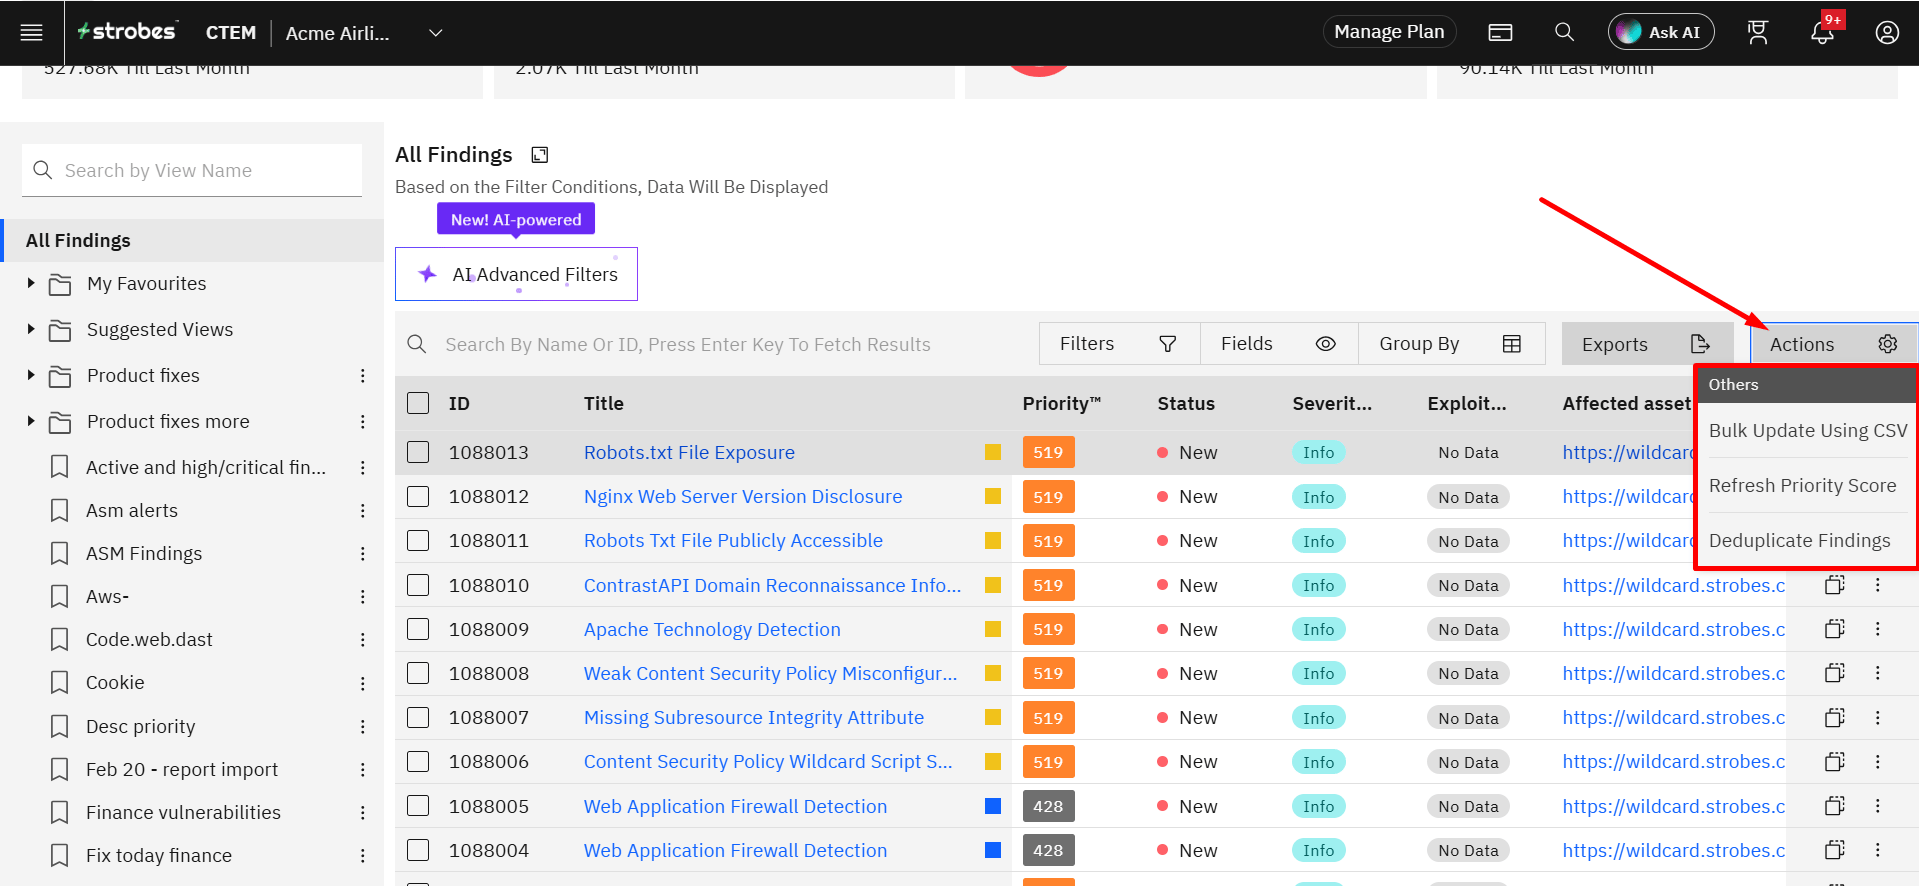
Actions is a menu that equips you with greater functionality such as exporting reports in various formats as well as refreshing the priority score.
Ideally, the priority score for the findings is refreshed every 4 hours. But in case, if you would like to refresh the score immediately, you can use the "Refresh Priority Score" option.
Search
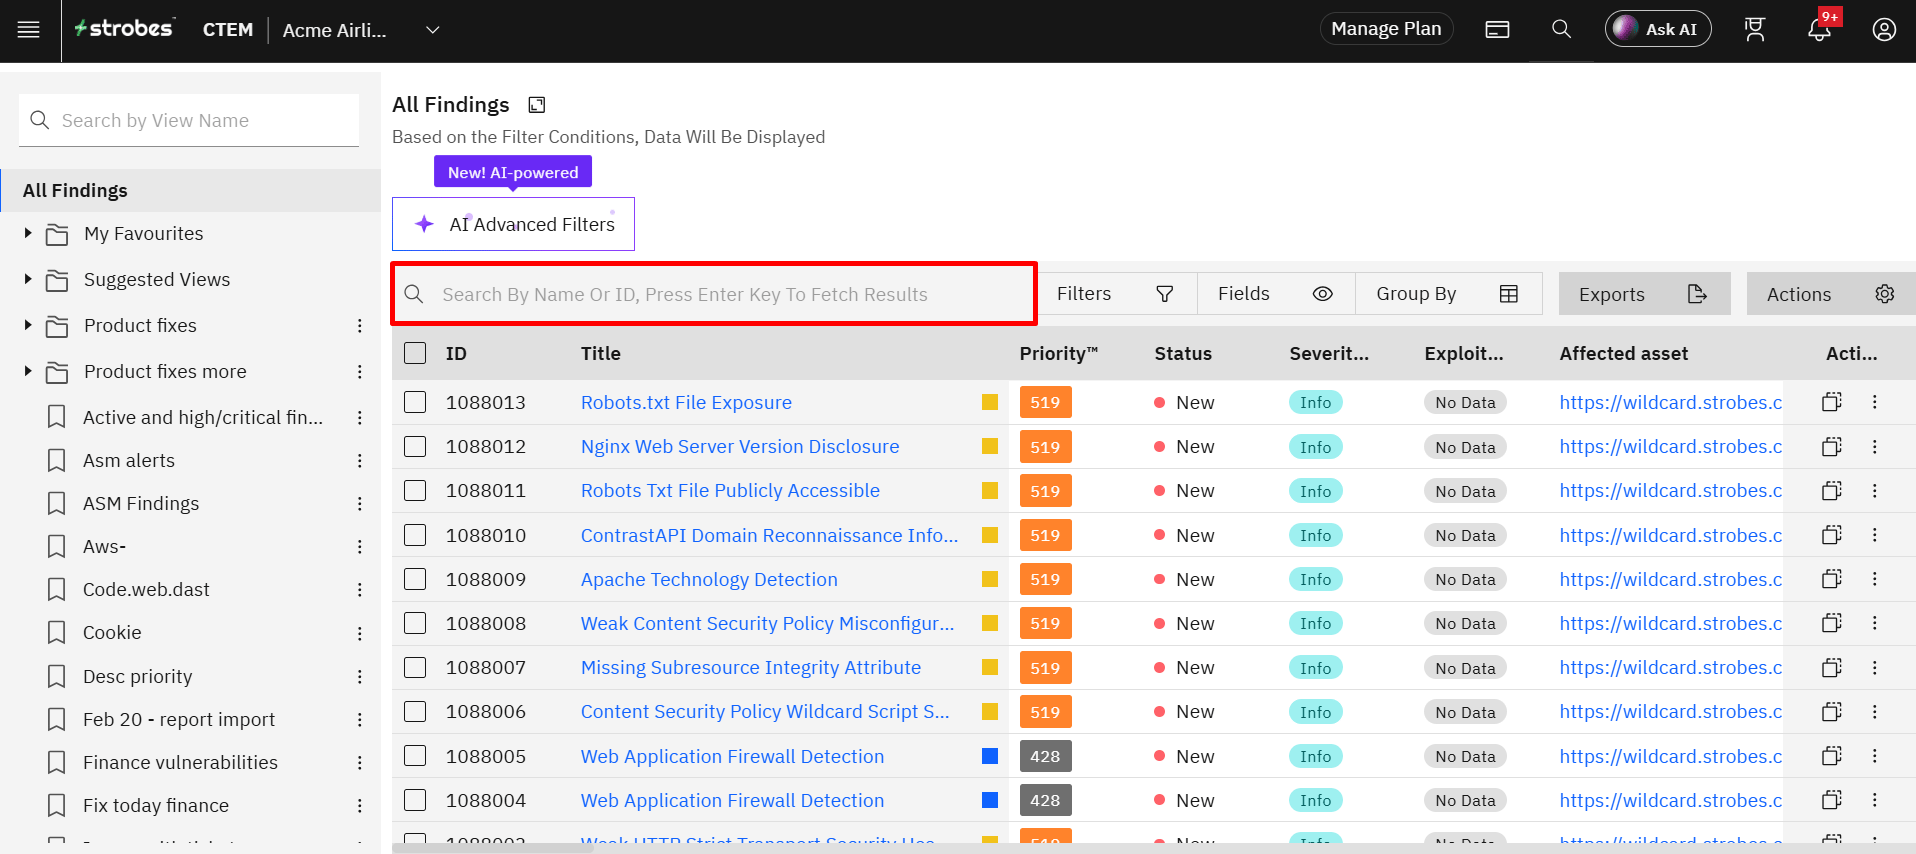
Lookup and filter the results in the current page.
New Finding
The New Finding button takes you to the finding logging flow.
More in Findings
Was this page helpful?