
Reports Module in Strobes
Overview
The Reports section in Strobes is designed to help users manage, generate, and customize vulnerability and security assessment reports. It consists of two primary tabs:
- Reports
- Template Library
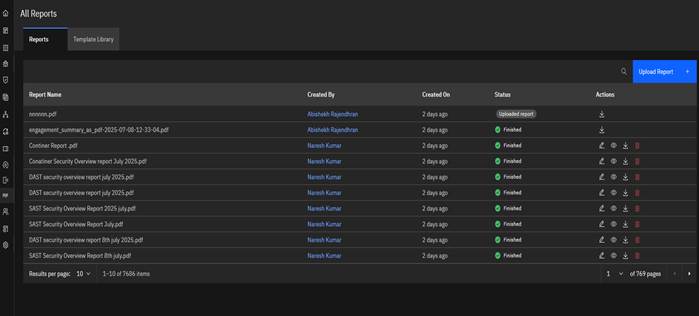
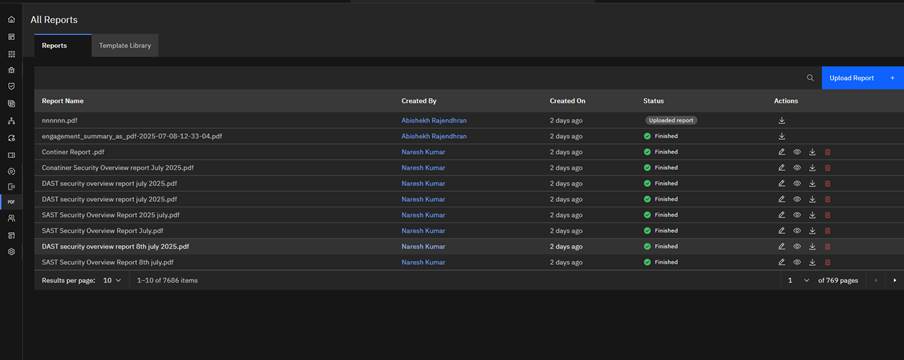
Reports Tab
This tab displays all reports that have been uploaded or generated from within the Strobes platform. Supported formats include PDF and CSV.
Key Features:
- Search Functionality: Easily search for existing reports.
- Upload Report: Users can manually upload a report using the Upload Report button.
- Report Details: The table includes columns such as:
- Report Name
- Created By
- Created On
- Status
- Actions
Template Library Tab
This tab provides access to default report templates and allows users to create and manage their own.
Default Templates:
Pre-configured templates include:
- Asset Summary Report
- SAST Security Overview Report
- DAST Security Overview Report
- Network Security Overview Report
- Cloud Security Overview Report
- Container Security Overview Report
- Executive Summary Report
- Default Template
Each template is labeled by type (e.g., Findings, Assets) and is marked as Strobes Default.
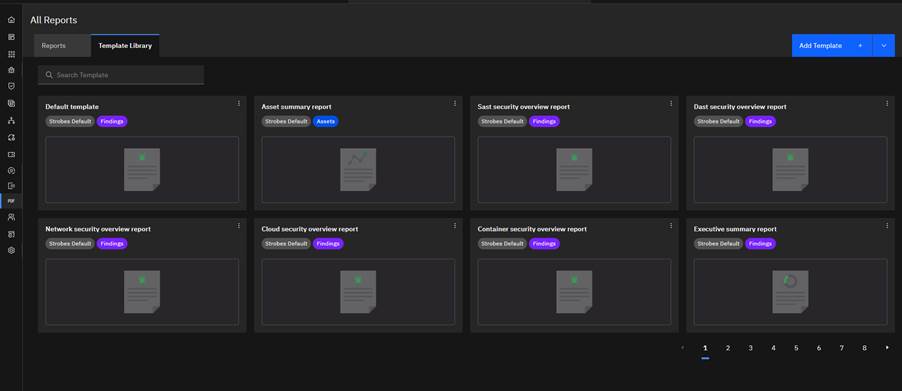
Add Template:
Users can click on the Add Template button to create new customized templates tailored to their organization’s reporting requirements.
Template Creation in Strobes
This guide walks you through creating and managing templates in Strobes, starting from the Reports page.
Step 1: Navigate to Reports Page
- From the left navigation panel, click the Reports icon.
- You'll land on the "All Reports" screen.
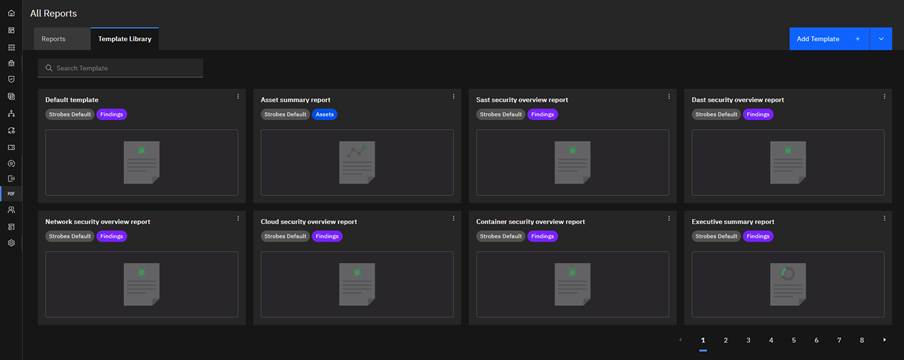
- Click on the "Template Library" tab at the top.
Step 2: Add a New Template
- On the Template Library tab, click the blue “Add Template” button on the top right corner.
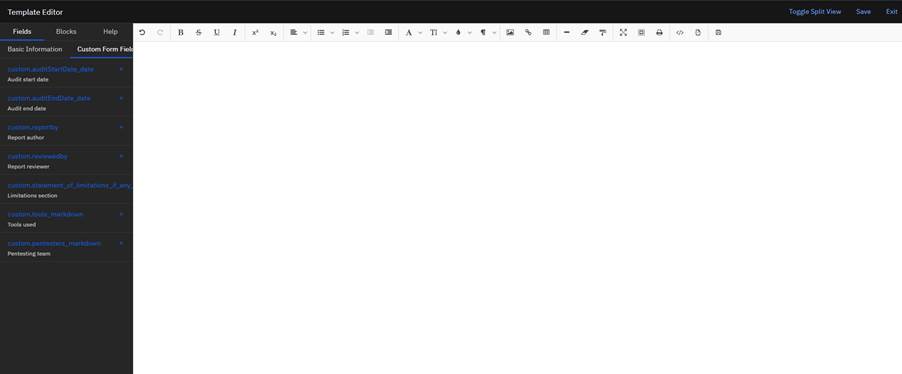
- LEFT PANEL – Configuration Options
This is where you’ll select elements into your report layout by clicking on the ‘+’ icon next to the element.
- Fields Section
This is further divided into:
1. Basic Information Fields
- info.exported_on: The date when the report was generated (format: dd-mm-yyyy)
- info.hosted_address: The base URL of the platform where the report is hosted
- info.api_address: The API endpoint used for accessing media files
- info.deployment_mode: The current deployment type (either 'enterprise' or 'saas')
- info.organization_name: The name of the organization associated with the report
- info.organization_id: A unique identifier assigned to the organization
- info.assets_count: The total number of assets included in the report
- info.finding_count: The total number of findings documented in the report
- info.exported_by: The user who performed the report export
- info.asset_ids: A list containing the IDs of the assets present in the report
- info.bug_ids: A list containing the IDs of the bugs/findings present in the report
2. Custom Form Fields
3. Engagement Fields
- engagement.id: Unique engagement identifier
- engagement.name: Engagement name
- engagement.vendor: Vendor information
- engagement.organization: Organization details
- engagement.scheduled_date: Scheduled start date
- engagement.delivery_date: Expected delivery date
- engagement.security_posture: Security posture assessment
- engagement.executive_summary: Executive summary
- engagement.created_by: User who created the engagement
- engagement.created: Creation timestamp
- engagement.updated: Last update timestamp
- engagement.credits_estimated: Estimated credits
- engagement.credits: Actual credits used
- engagement.plans: Associated plans
- engagement.documents: Related documents
- engagement.subscribed_services: Subscribed services
- engagement.fields: Custom field data
4. Summary Metrics
- summary_data.state_metrics.state: State name (new, active, resolved, etc.)
- summary_data.state_metrics.count: Number of findings
- summary_data.state_metrics.height: Chart height percentage
- summary_data.severity_metrics.severity: Severity level (critical, high, medium, low, info)
- summary_data.severity_metrics.count: Number of findings
- summary_data.severity_metrics.width: Chart width percentage
5. Enum Mappings
- enums.asset_type_choices: Asset type mappings
- enums.asset_sensitivity_choices: Sensitivity level mappings
- enums.asset_exposed_choices: Exposure level mappings
6. Query Language Count Functions
How to Access Fields in Templates ?
- Basic Field Access Access organization and report information:
{{ info.organization_name }}
{{ info.exported_on }}
{{ info.finding_count }}
- Findings Iterating Through Assets Loop through assets in chunks (24 per page):
{% for list in assets %}
{% for asset in list %}
<tr>
<td>{{ asset.name }}</td>
<td>{{ asset.target }}</td>
<td>{{ enums.asset_type_choices[asset.type] }}</td>
<td>{{ enums.asset_exposed_choices[asset.exposed] }}</td>
</tr>
{% endfor %}
{% endfor %}
- Iterating Through Findings
Loop through all findings:
{% for bug in findings %}
<div class="finding">
<h2>{{ bug.title }}</h2>
<p><strong>Severity:</strong> {{ bug.severity_label }}</p>
<p><strong>Status:</strong> {{ bug.state_label }}</p>
<p><strong>Asset:</strong> {{ bug.asset.name }}</p>
<p><strong>Description:</strong> {{ bug.description }}</p>
</div>
{% endfor %}
- Accessing Asset Data
For network assets, access specific data fields:
{% if bug.asset.type == 3 %}
{% if bug.asset.data.ipaddress %}
<p><strong>IP Address:</strong> {{ bug.asset.data.ipaddress }}</p>
{% endif %}
<p><strong>Hostname:</strong> {{ bug.asset.data.hostname|default("None") }}</p>
<p><strong>MAC Address:</strong> {{ bug.asset.data.mac_address|default("None") }}</p>
{% endif %}
- Conditional Rendering
Check if data exists before displaying:
{% if bug.connector_config %}
<p><strong>Scanner:</strong> {{ bug.connector_config.name }}</p>
{% endif %}
{% if bug.reported_by %}
<p><strong>Reported by:</strong>
{% if bug.reported_by.first_name %}
{{ bug.reported_by.first_name|capitalize }} {{ bug.reported_by.last_name|capitalize }}
{% else %}
{{ bug.reported_by.email }}
{% endif %}
</p>
{% endif %}
- Working with Lists
Display CWE references:
{% if bug.cwe|length > 0 %}
{% for cwe in bug.cwe %}
<span class="tag">{{ cwe.type }}</span>
{% endfor %}
{% else %}
<span>None</span>
{% endif %}
- Summary Charts
Display severity distribution:
{% for stat in summary_data.severity_metrics %}
{% if stat.count > 0 %}
<div style="width:{{ stat.width }}%" class="{{ stat.severity }}">
{{ stat.count }}
</div>
{% endif %}
{% endfor %}
- User Information
Display user details with fallbacks:
{% if info.exported_by.first_name %}
<div class="user-avatar">
{{ info.exported_by.first_name[:1] }}{{ info.exported_by.last_name[:1] }}
</div>
{{ info.exported_by.first_name|capitalize }} {{ info.exported_by.last_name|capitalize }}
{% else %}
{{ info.exported_by.email }}
<div class="user-avatar">
{{ info.exported_by.email[:1] }}
</div>
{% endif %}
- Custom Fields
Access custom field data:
{% if asset.fields %}
{% for field_name, field_value in asset.fields.items() %}
<p><strong>{{ field_name }}:</strong> {{ field_value }}</p>
{% endfor %}
{% endif %}
- Date Formatting
Format timestamps:
{{ bug.created_time }} / {{ bug.created_date }}
{{ bug.updated_time }} / {{ bug.updated_date }}
- Conditional Asset Types
Handle different asset types:
{% if bug.asset.type == 1 %}
<p><strong>URL:</strong> {{ bug.asset.target|default("None") }}</p>
{% elif bug.asset.type == 2 %}
<p><strong>Package:</strong> {{ bug.asset.target|default("None") }}</p>
{% elif bug.asset.type == 3 %}
<p><strong>Network Asset:</strong> {{ bug.asset.data.hostname|default("None") }}</p>
{% endif %}
- Blocks Section
Blocks allow you to insert different structured items into the report. These can be rearranged to form the layout and format of the final report.
Some commonly available block types are:
- Cover Page
- Executive Summary
- Finding Detail
- Severity Chart
- Risk Assessment
- Key Findings
- Asset Summary
- Web Vulnerability Detail
- Code Vulnerability Detail
- Timeline Chart
- Prioritized Remediation
- Methodology
RIGHT PANEL – Canvas/Live Layout
- This is the actual structure of your report that gets built as you drag and drop blocks from the left.
- You can rearrange elements using drag-and-drop.
- Click any block to edit its content, label, field mappings, or style.
- You can preview how each block will appear in the final PDF.
- Use delete or duplicate as needed.
Step 4: Customize Using Code (Optional)
- Click the </> (code) icon from the top toolbar to switch to code view.
- You can now add or modify HTML and CSS to fully customize your template’s layout and styling.
Step 5: Save the Template
- Once editing is complete, click Save on the top right.
- Enter the template name in the popup.
- Click Save again to finish.
Step 6: Clone or Edit Existing Templates
- In the Template Library, each template (default or custom) has a three-dot menu (⋮).
- For default templates, options include:
- Clone – Creates a copy which you can rename and edit.
- For custom templates, options include:
- Edit – Open for editing
- Add Header/Footer – Insert standard header/footer blocks
- Delete – Remove the template
Note: You cannot directly edit or delete default templates — you must clone them first and then modify.
Generating a Report Using an Existing Template (Post Template Creation)
Step 1: Go to the Findings Page
- Navigate to the Findings section from the left sidebar.
Step 2: Select Findings
- Use the checkboxes to select the findings/vulnerabilities you want to include in the report.
- You can select one or multiple findings.
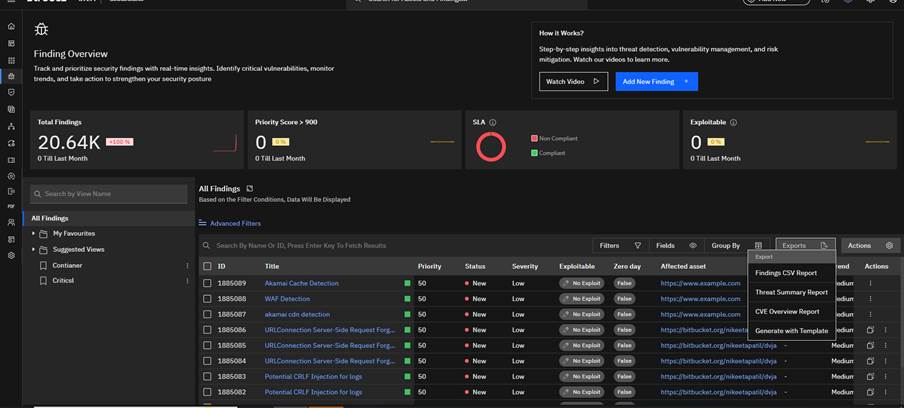
Step 3: Generate the Report
- Click on the Exports button at the top-right.
- From the dropdown, select Generate with Template.
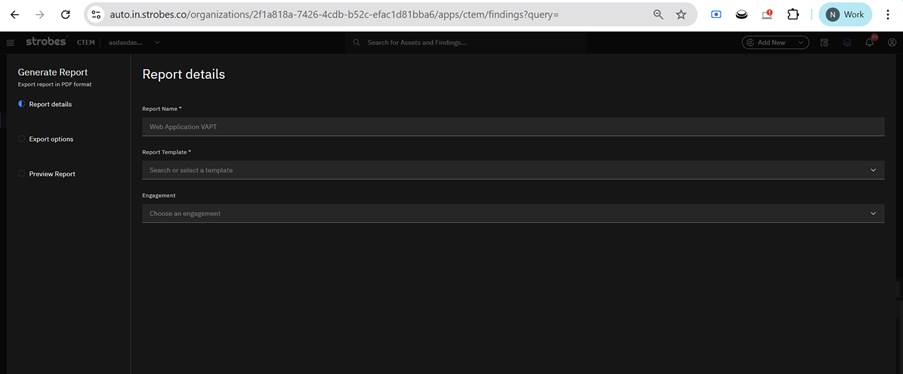
Step 4: Fill Report Details
- In the popup:
- Enter the Report Name.
- Choose the Template from the dropdown (use your created or default template).
- (Optional) Select an Engagement.
- Click Next.
Step 5: Add Custom Field Values (if applicable)
- If your selected template includes any custom fields, you'll be prompted to fill them.
- Enter the values as needed.
- Click Next.
Step 6: Preview Findings
- You’ll get a preview screen showing a sample (up to 5 findings).
- Review the preview and click Next.
Step 7: Finish Report Generation
- Click on Finish to generate the report.
- A success message will appear.
Step 8: Access the Report
- Go to the Reports section from the left sidebar.
- Under the Reports tab, your newly generated report will be listed.
Step 9: Download or Manage the Report
- From the Reports tab:
- Click to View the report.
- Click the download icon to Download it.
- Use the 3-dot menu to Delete if needed.
For the more info Click the Github link given below
https://github.com/strobes-co/guides/tree/main/reports