
Workspace Wizard Platform
This article explains the Workspace Dashboard — the live view of an in-flight pentest. Use it to watch progress, follow the agent's reasoning, and review findings as they're confirmed.
To open the dashboard, go to AI → Workspaces and click into the Workspace. The dashboard auto-refreshes every ~15 seconds while a run is active.
The dashboard has the following tabs across the top:
- Dashboard
- Findings
- Assets
- Tasks
- Files
- Approvals
- Reports
Now, let's take a look at each.
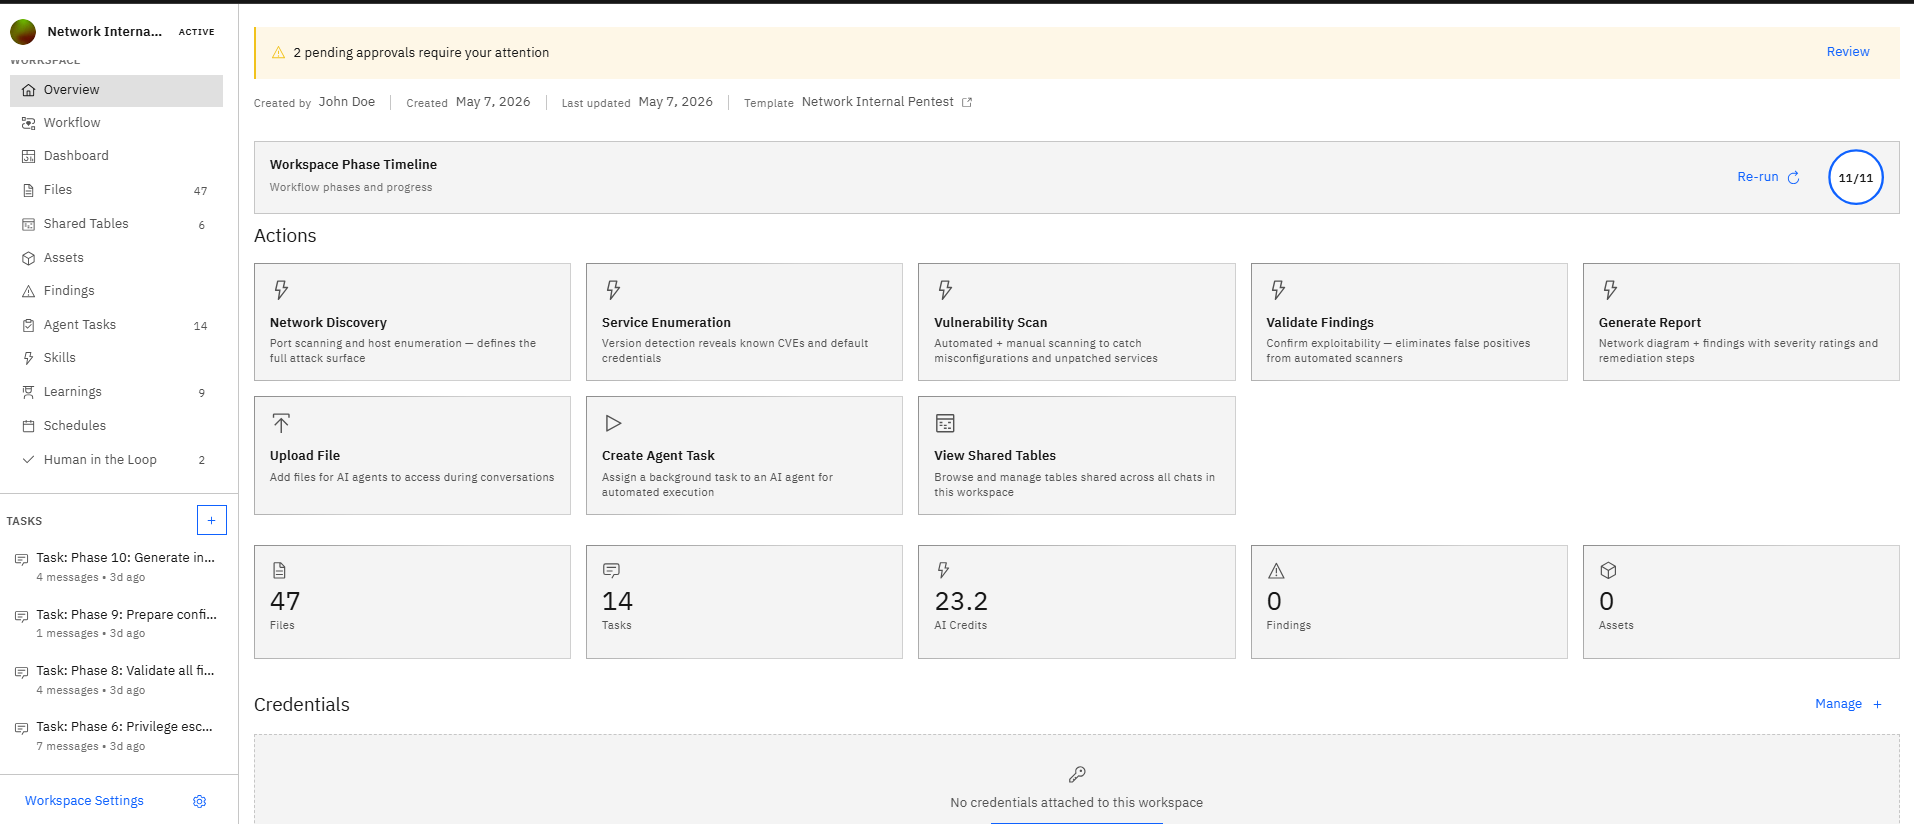
Dashboard
The default view. Shows status, elapsed time, the Workflow Phase Timeline, quick actions, and summary stats (number of files, tasks, AI credits used, findings, assets).
Findings
All findings produced by the agent, filterable by severity, status, and affected asset. Use this tab to triage results during and after the run.
Assets
Hosts, URLs, endpoints, repositories, and cloud resources the agent has discovered during the engagement. Useful for confirming the agent's understanding of scope.
Tasks
Sub-tasks the agent has spawned, including any still pending approval. Each task shows its own raw logs and current state.
Files
Files the agent has produced during the run — logs, evidence captures, payloads, screenshots, and reports.
Approvals
Items waiting for your explicit approval. This tab is only populated when Supervisor Mode is set to User for the Workspace.
Reports
Downloadable executive and technical reports. See Reviewing findings and generating reports for details.
The Activity panel
The Activity panel on the right side of the dashboard is a live feed of agent actions — tools used, findings created, sub-agents spawned. Use it to follow the agent's reasoning in real time.
For a full audit trail after the run, open Tasks (sub-agent breakdown) and Files (every artifact the agent produced). You can also read the entire Chat thread.