
Configuring Nessus by Tenable in Strobes
Overview
The Nessus by Tenable connector lets you pull your Tenable scan results directly into Strobes. Once connected, synced findings are deduplicated against results from your other scanners, risk-scored based on exploitability and business impact, and routed into your existing ticketing workflows. This article covers the full setup: opening the connector, creating a Nessus credential, configuring scan and merge settings, setting a sync schedule, connecting ticketing platforms, and running your first sync.
Prerequisites
Before you begin, make sure you have:
- Owner/Manager access to your Strobes account.
- A running Nessus instance with a reachable URL (default port 8834) and a Nessus user account with permission to view scans.
- The Scan ID of the Nessus scan you want to sync (found on the scan's details page inside your Nessus console).
- The following details ready for the Add a credential form:
- URL: Your Nessus server address, e.g., https://<your-nessus-host>:8834
- Username: Your Nessus username
- Password: Your Nessus password
- If you plan to push findings to a ticketing tool, make sure ServiceNow ITSM, GitHub Issues, Azure Boards, or Jira is already connected in Strobes.
Step 1: Open the Nessus Connector
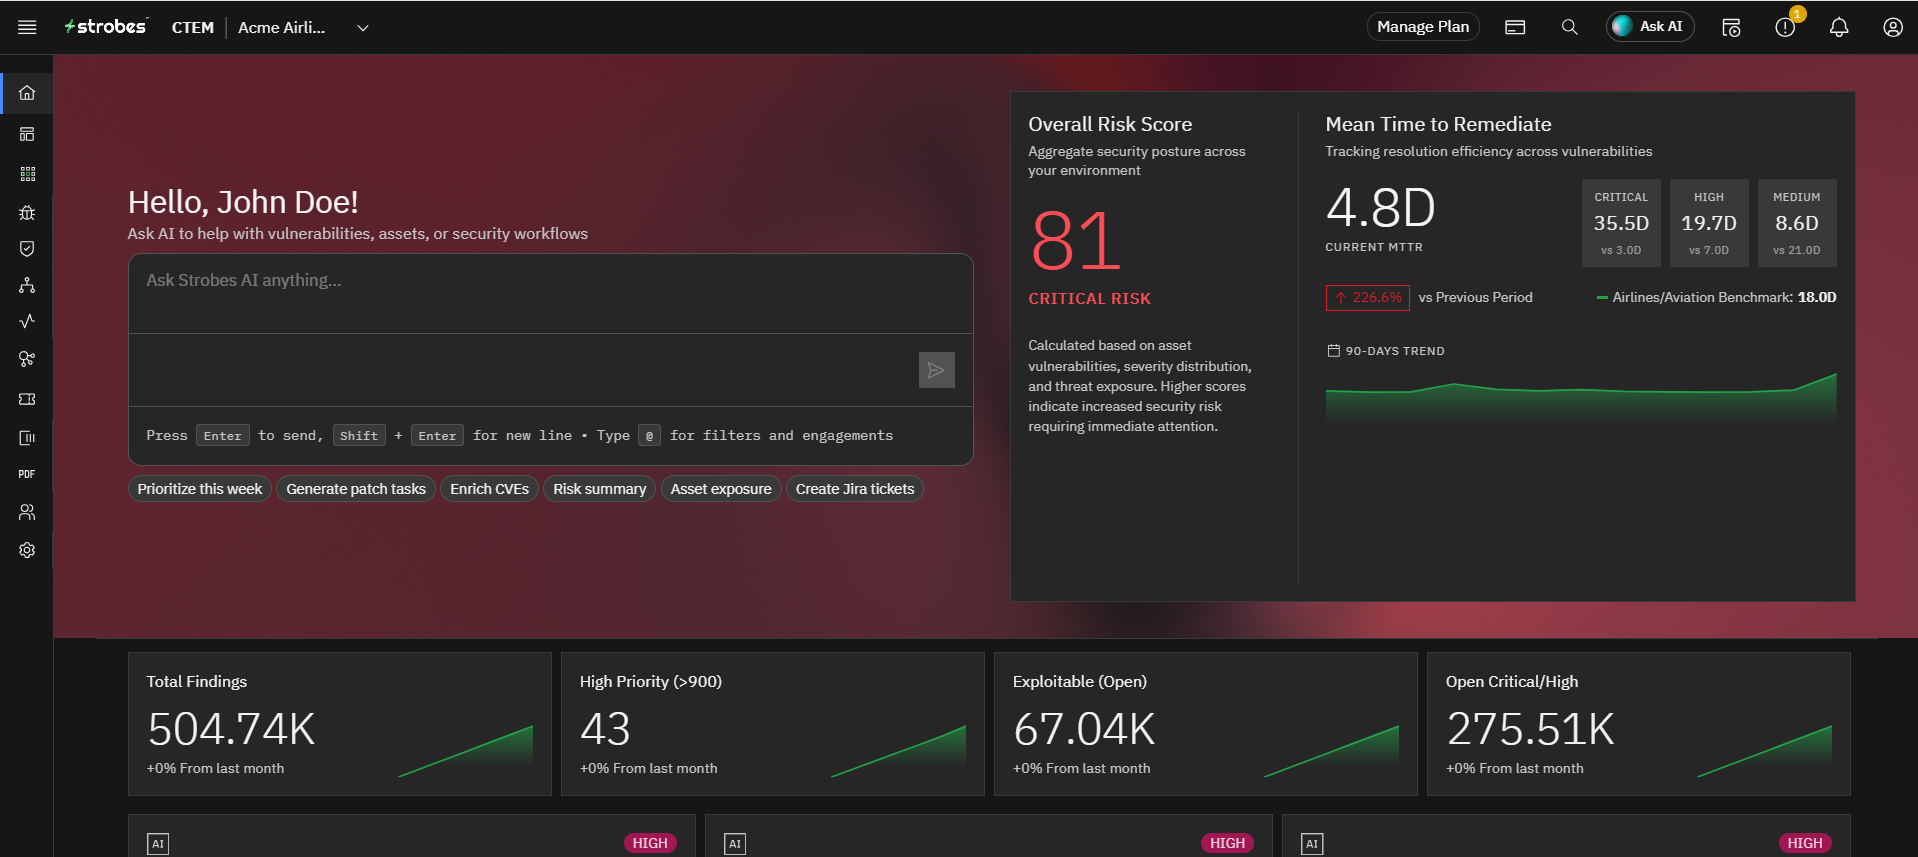
- Log in to your Strobes Dashboard.
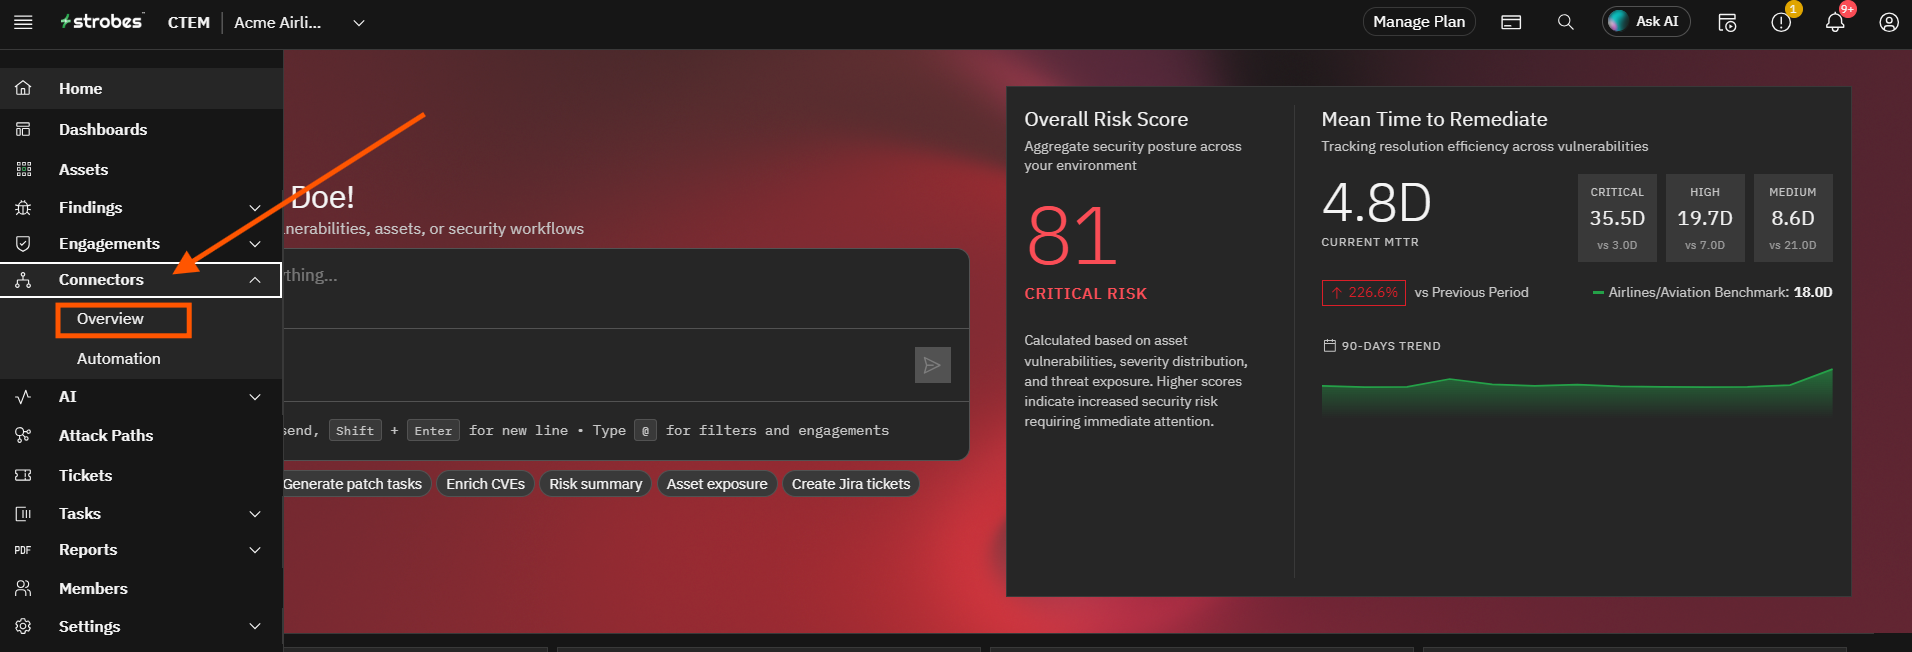
- From the left-hand navigation menu, click Connectors.
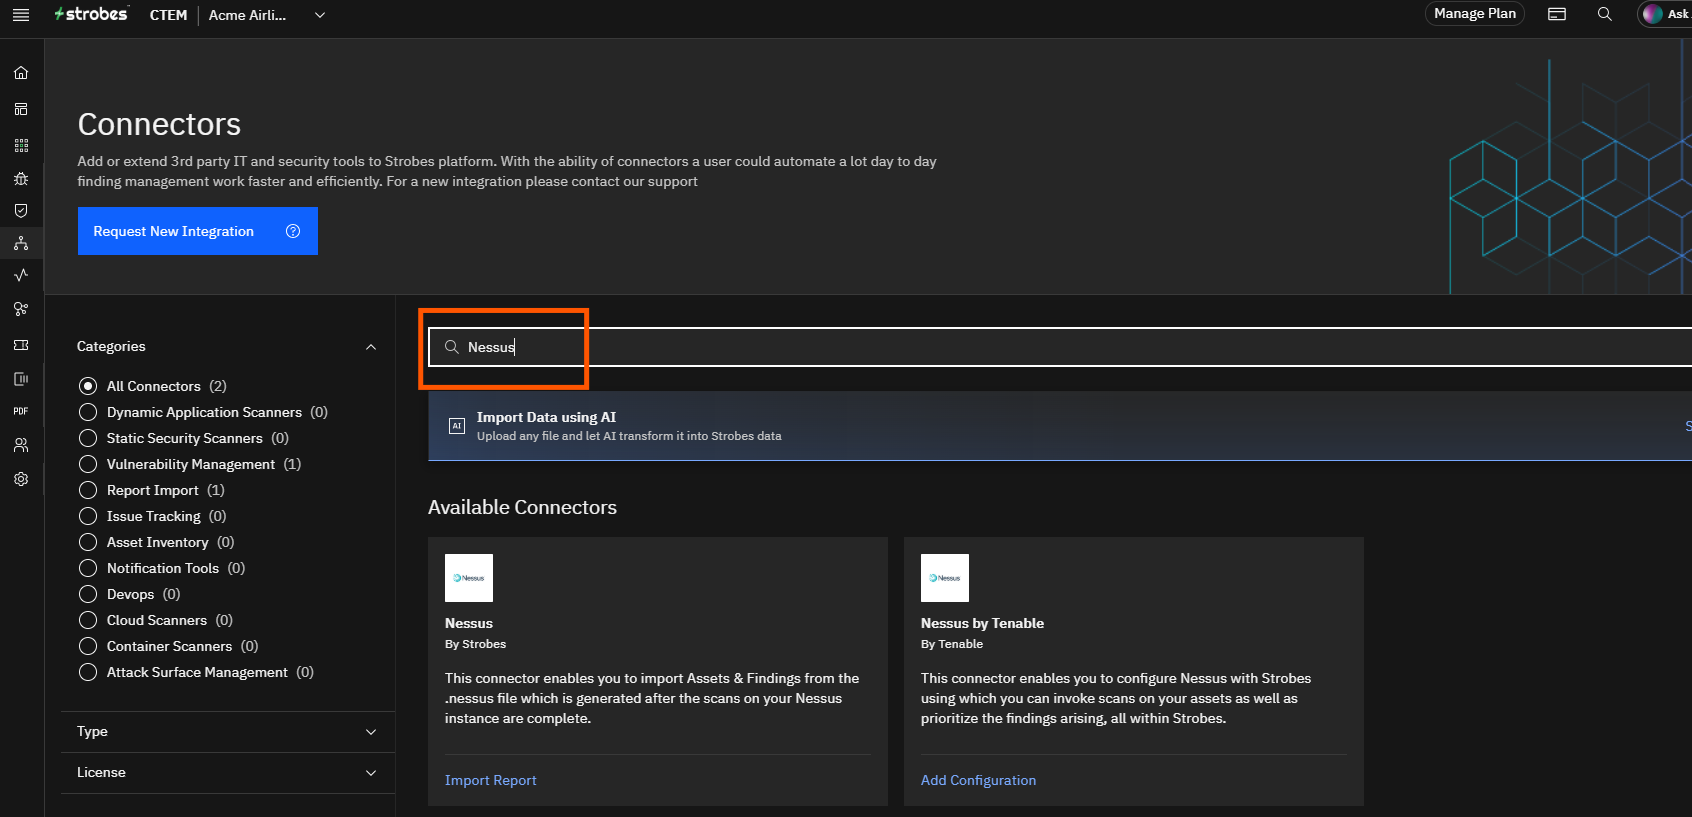
- On the Connectors page, click into the Look for Connectors search bar and type Nessus.
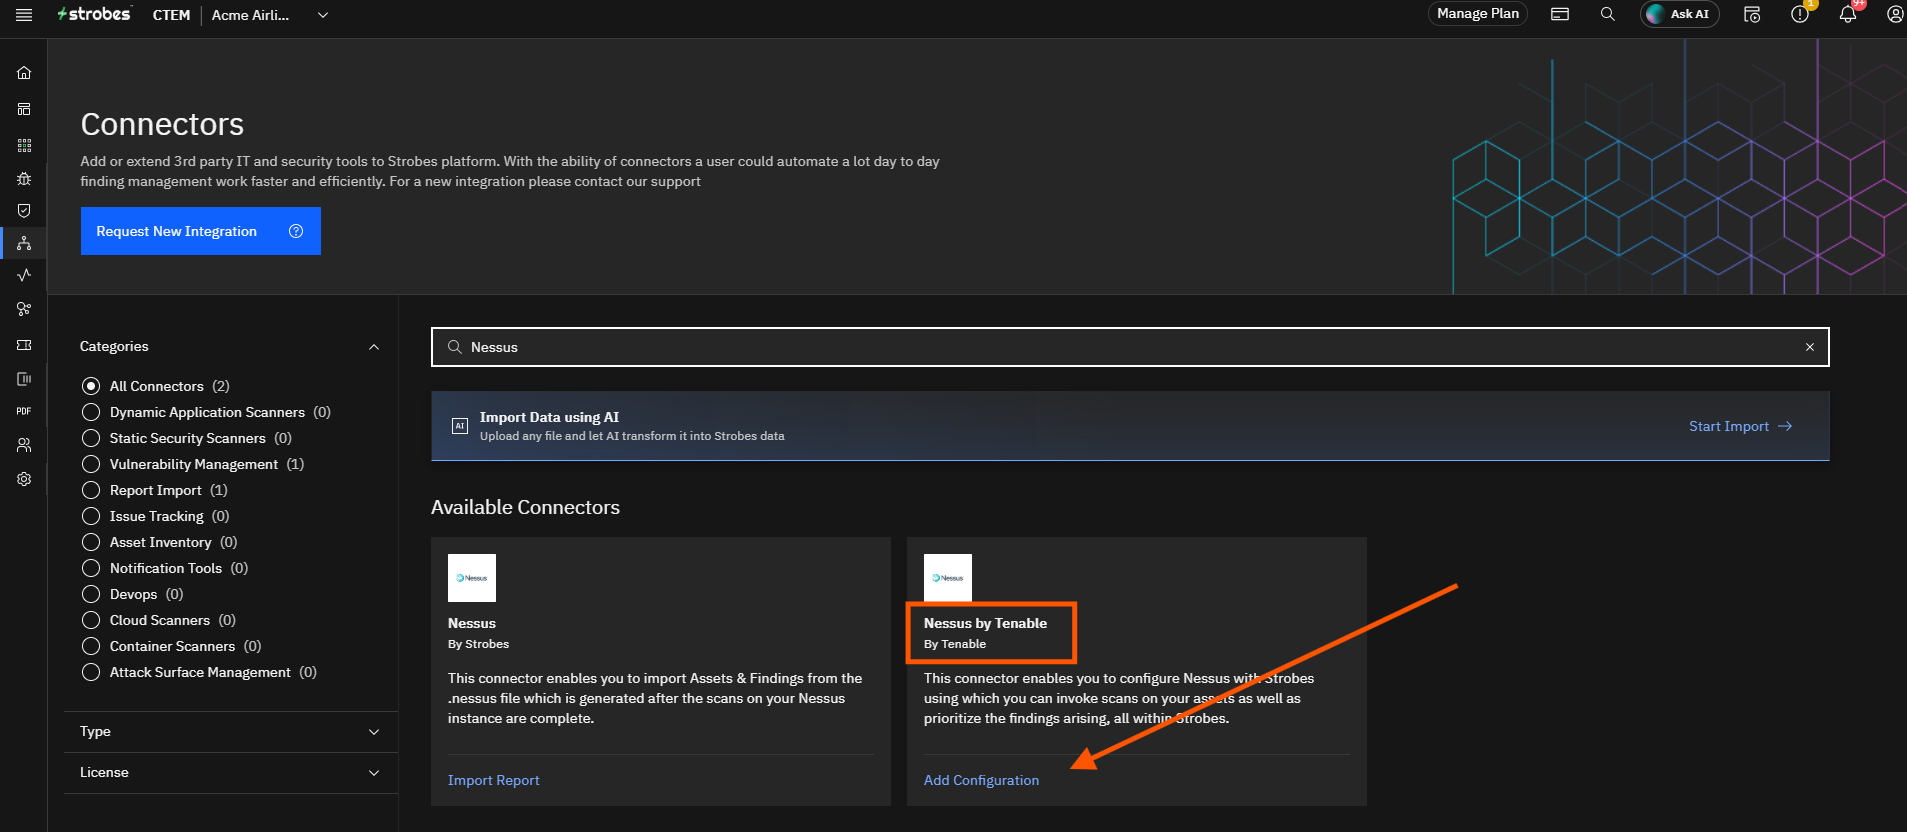
- Click on the Nessus by Tenable connector card.
Step 2: Start a New Workflow
- Inside the Nessus by Tenable panel, locate the Workflows section.
Click the + icon next to Workflows to open the Add Workflow wizard.
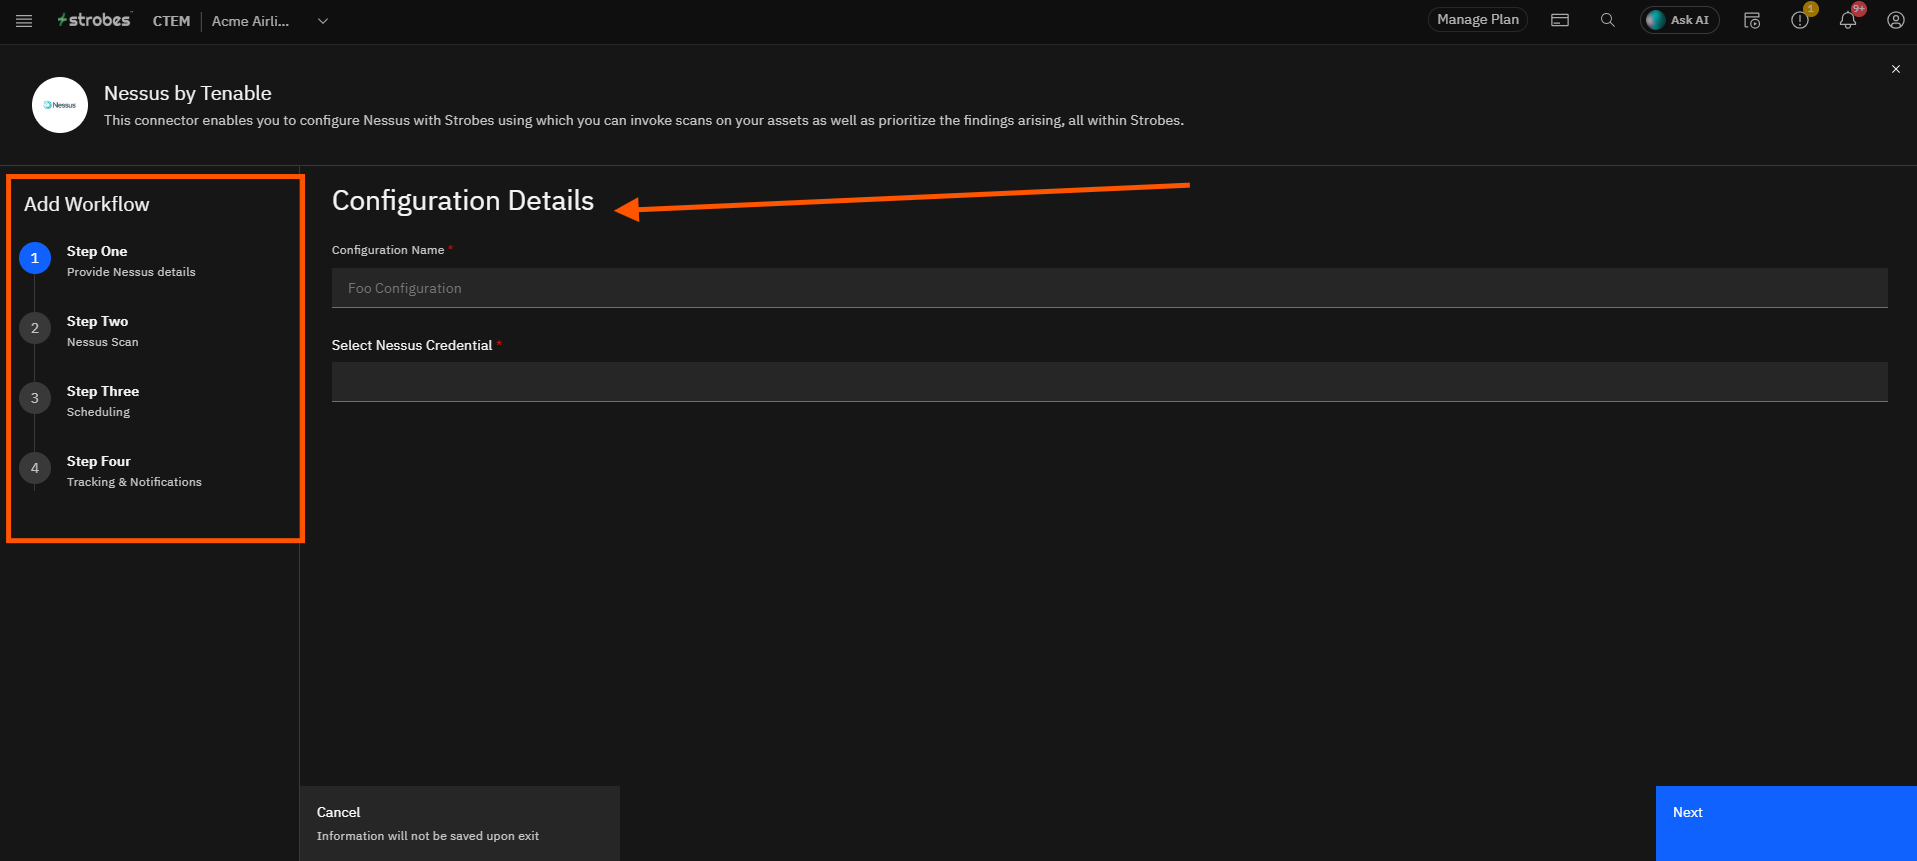
Step 3: Provide Nessus Details & Add Your Credential
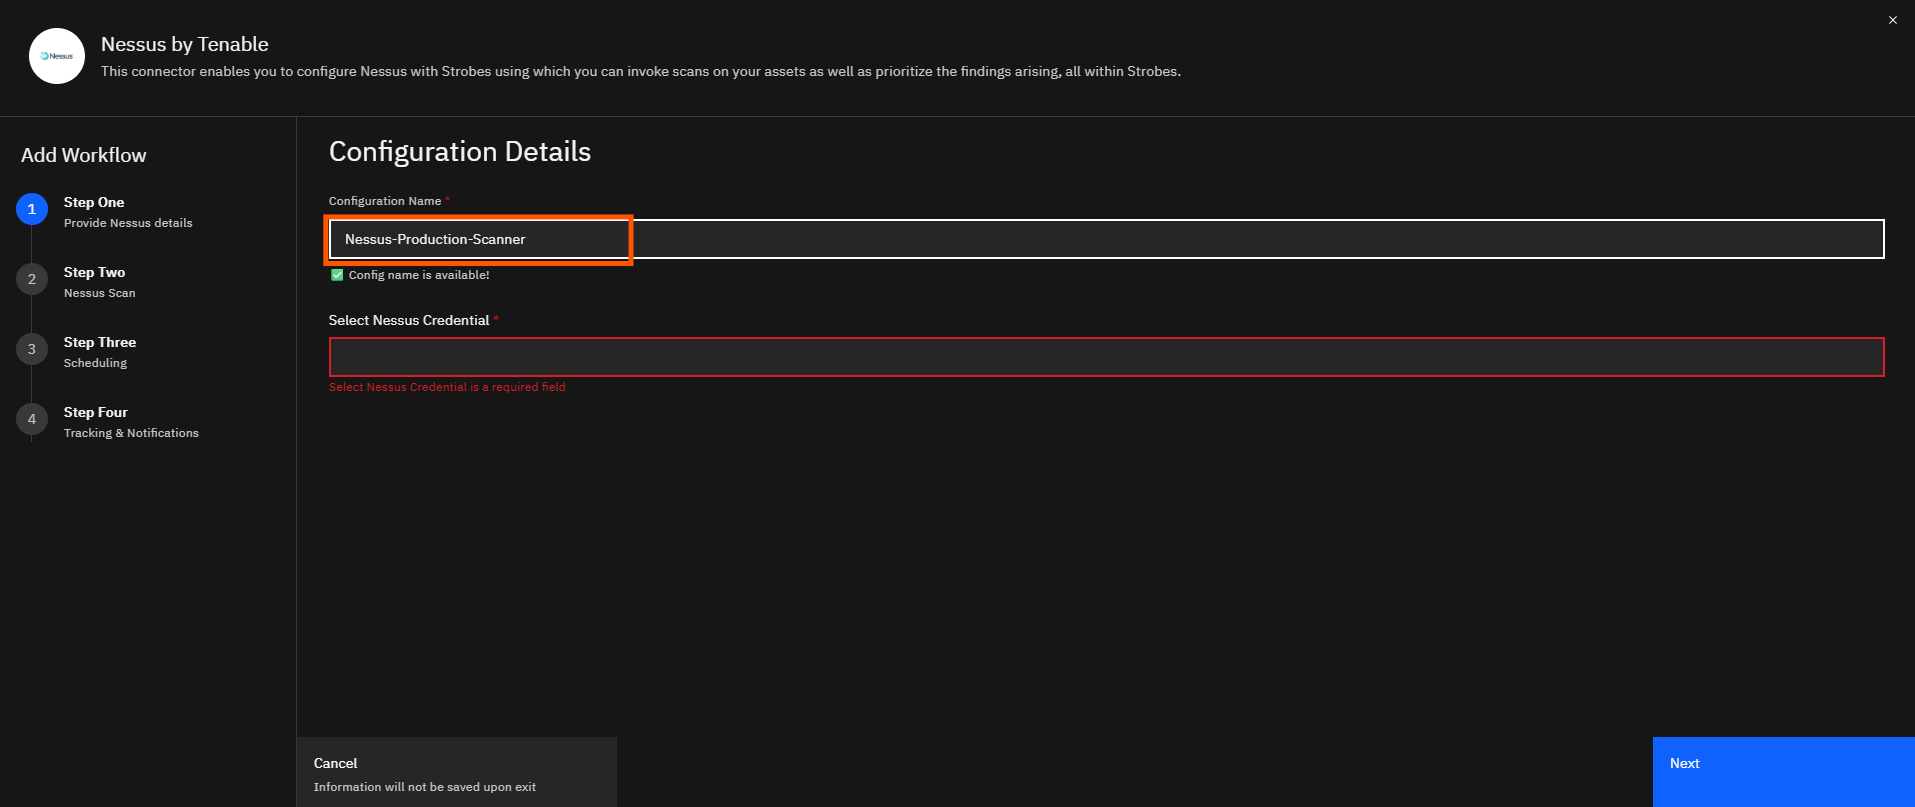
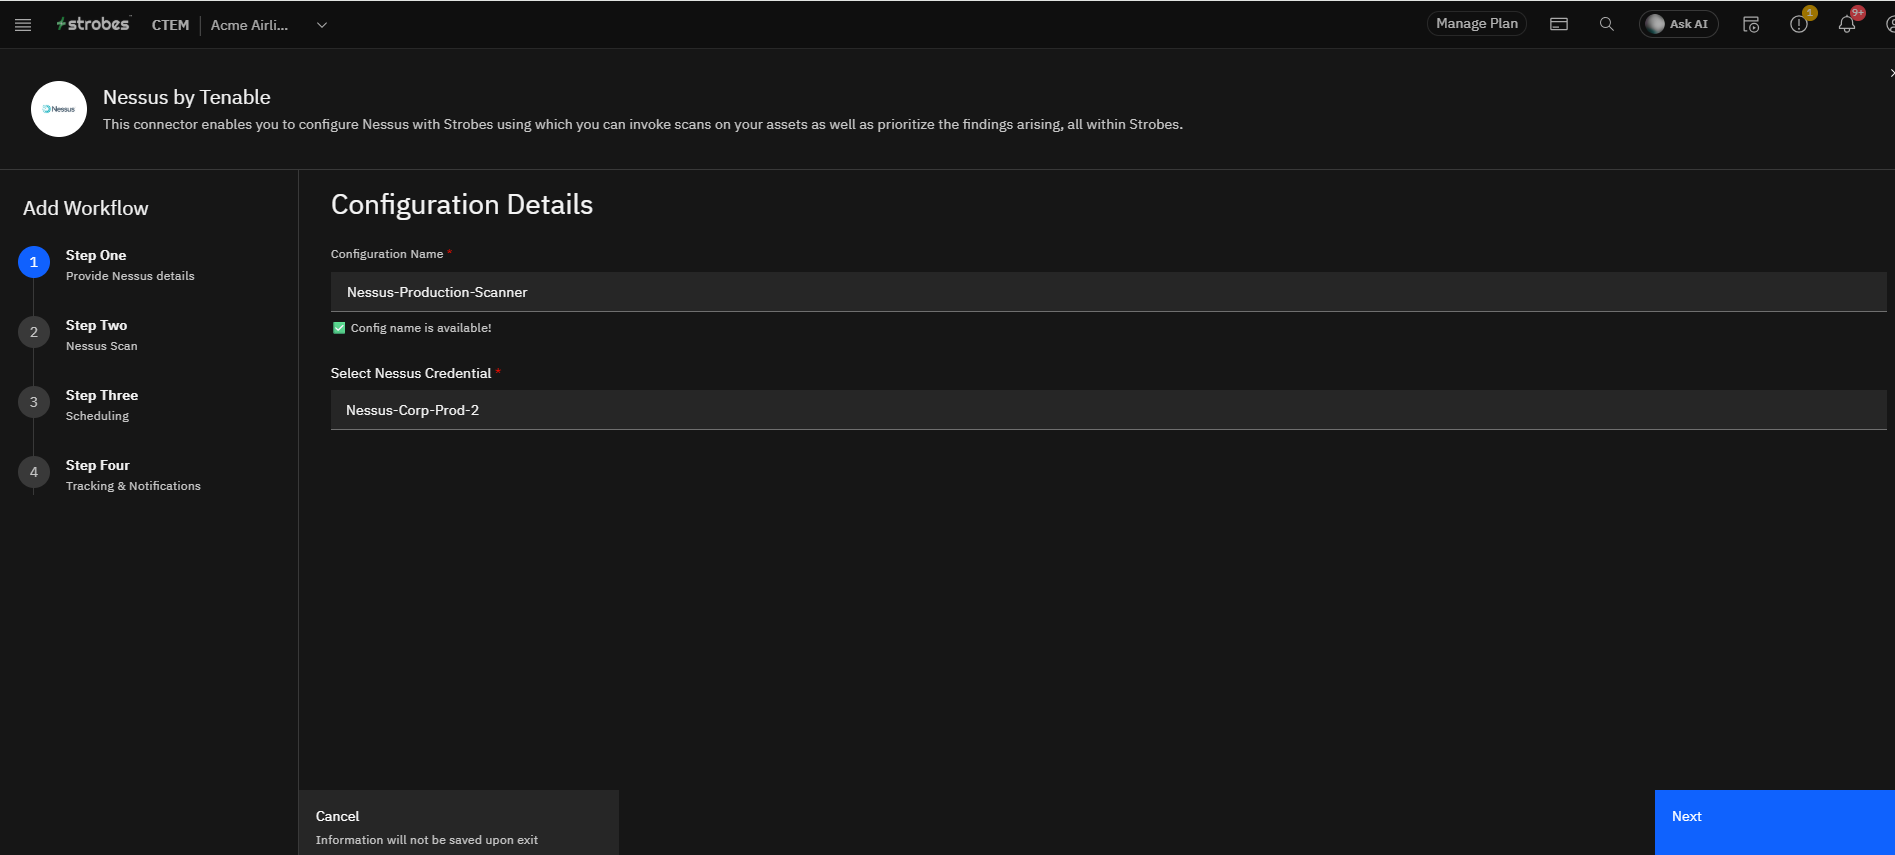
- Under Configuration Details, enter a Configuration Name.
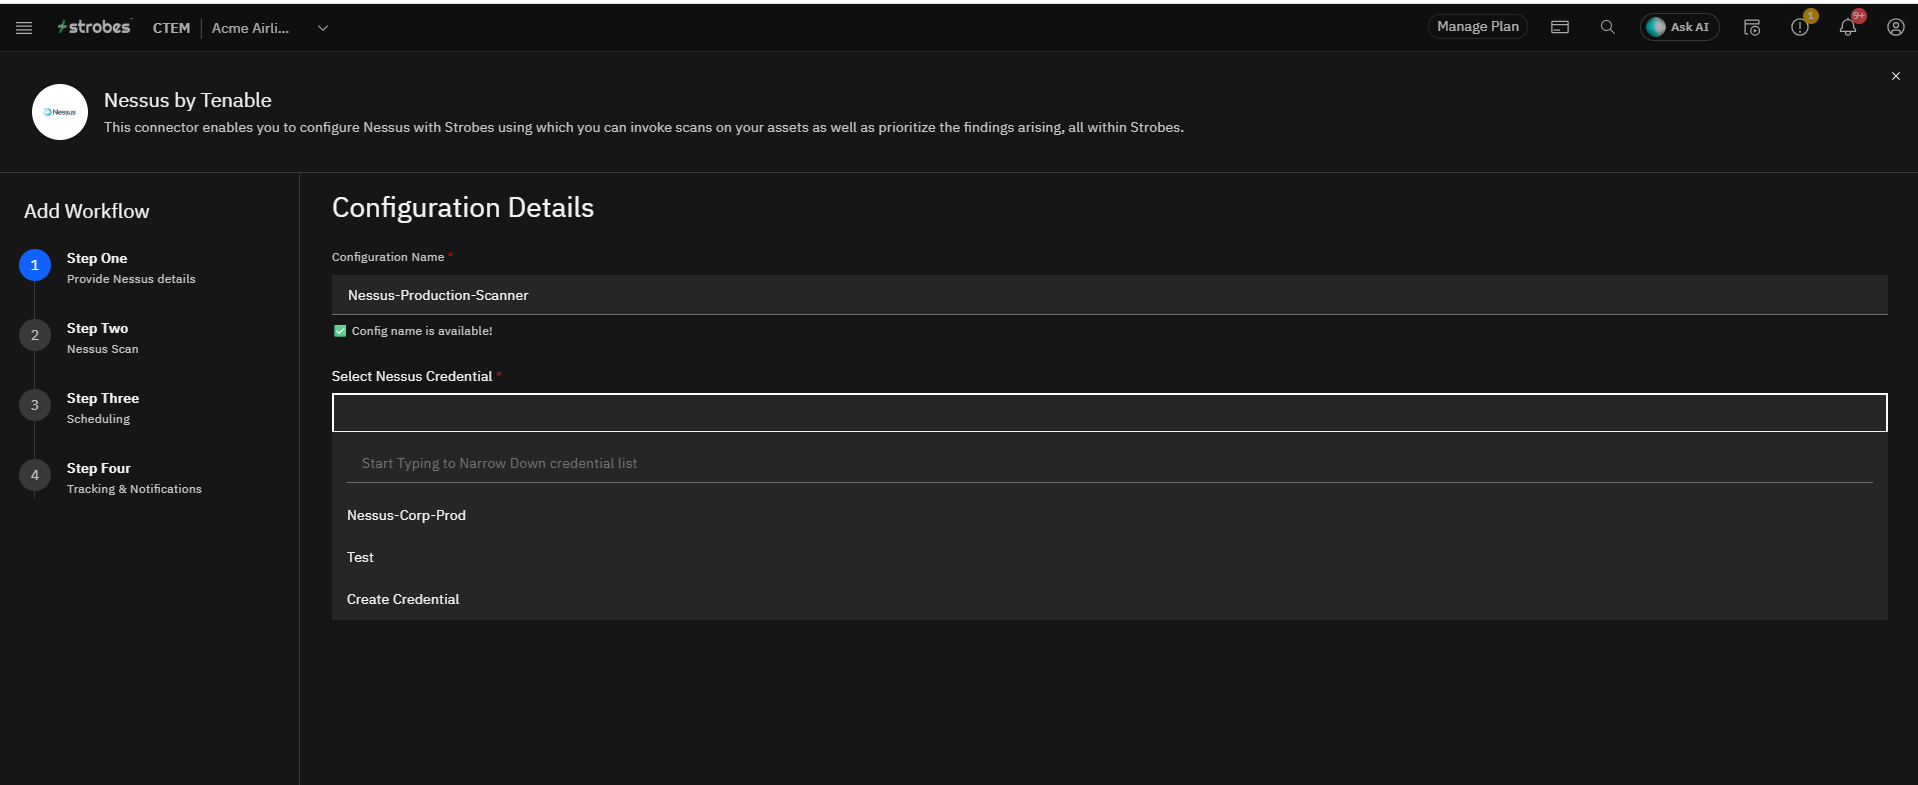
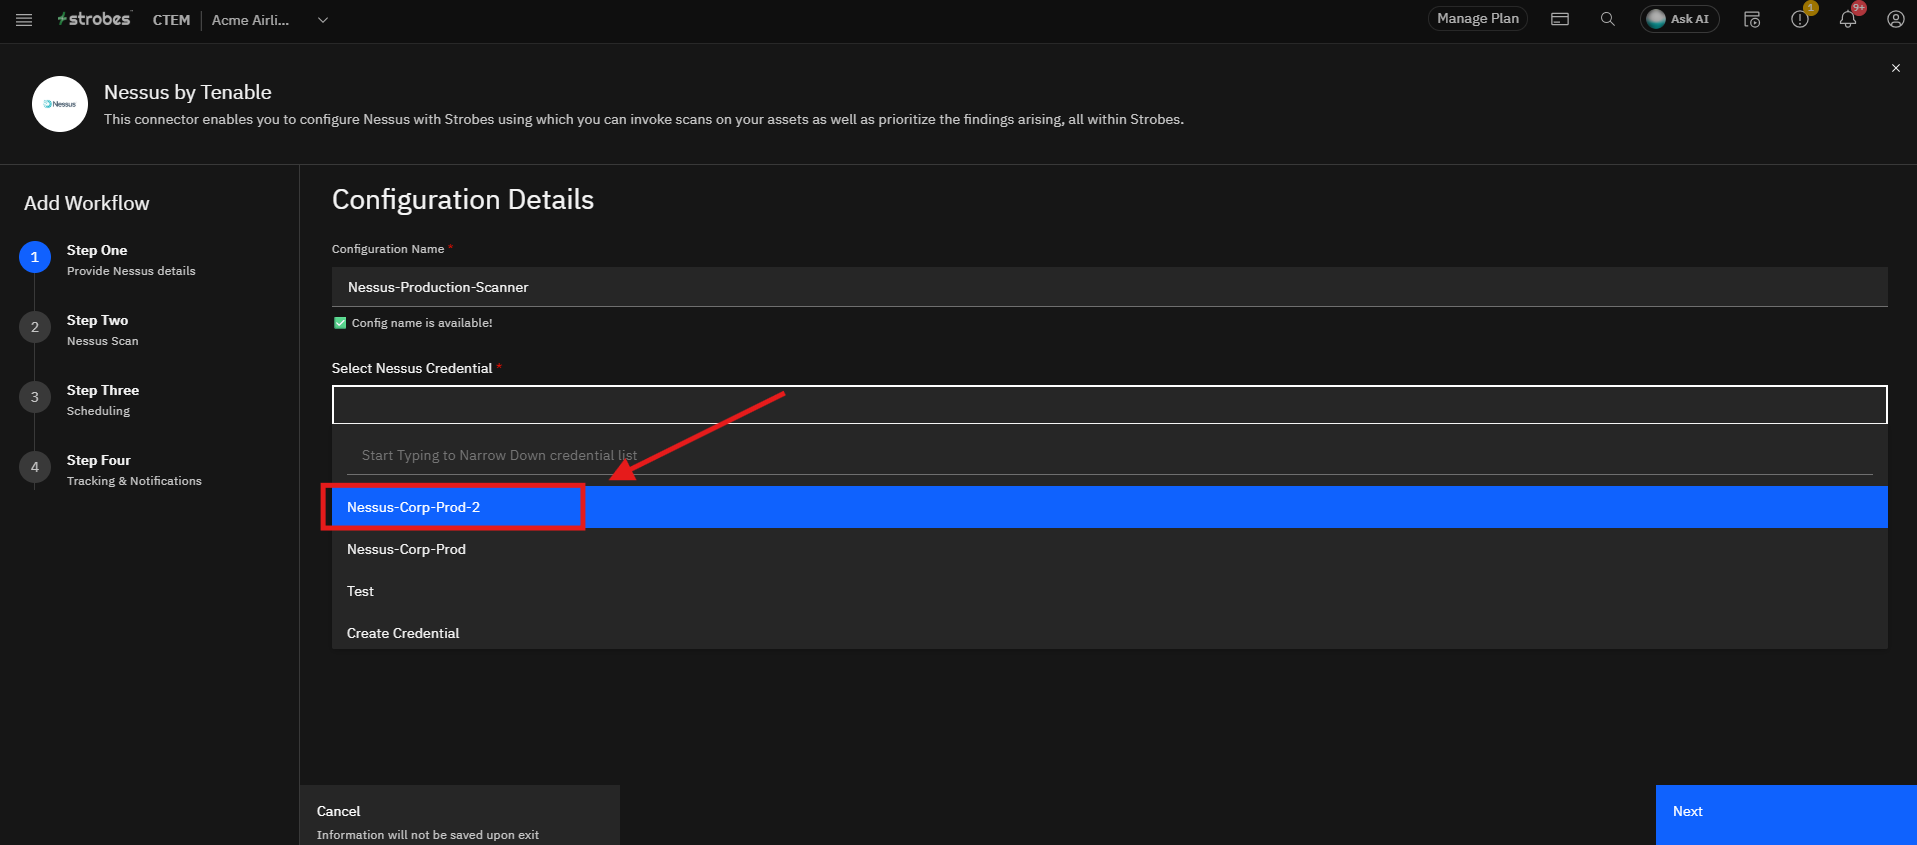
Example: Nessus-Production-Scanner - Click the Select Nessus Credential dropdown. If you had added credentials previously, it will be listed here. If not; follow the steps.
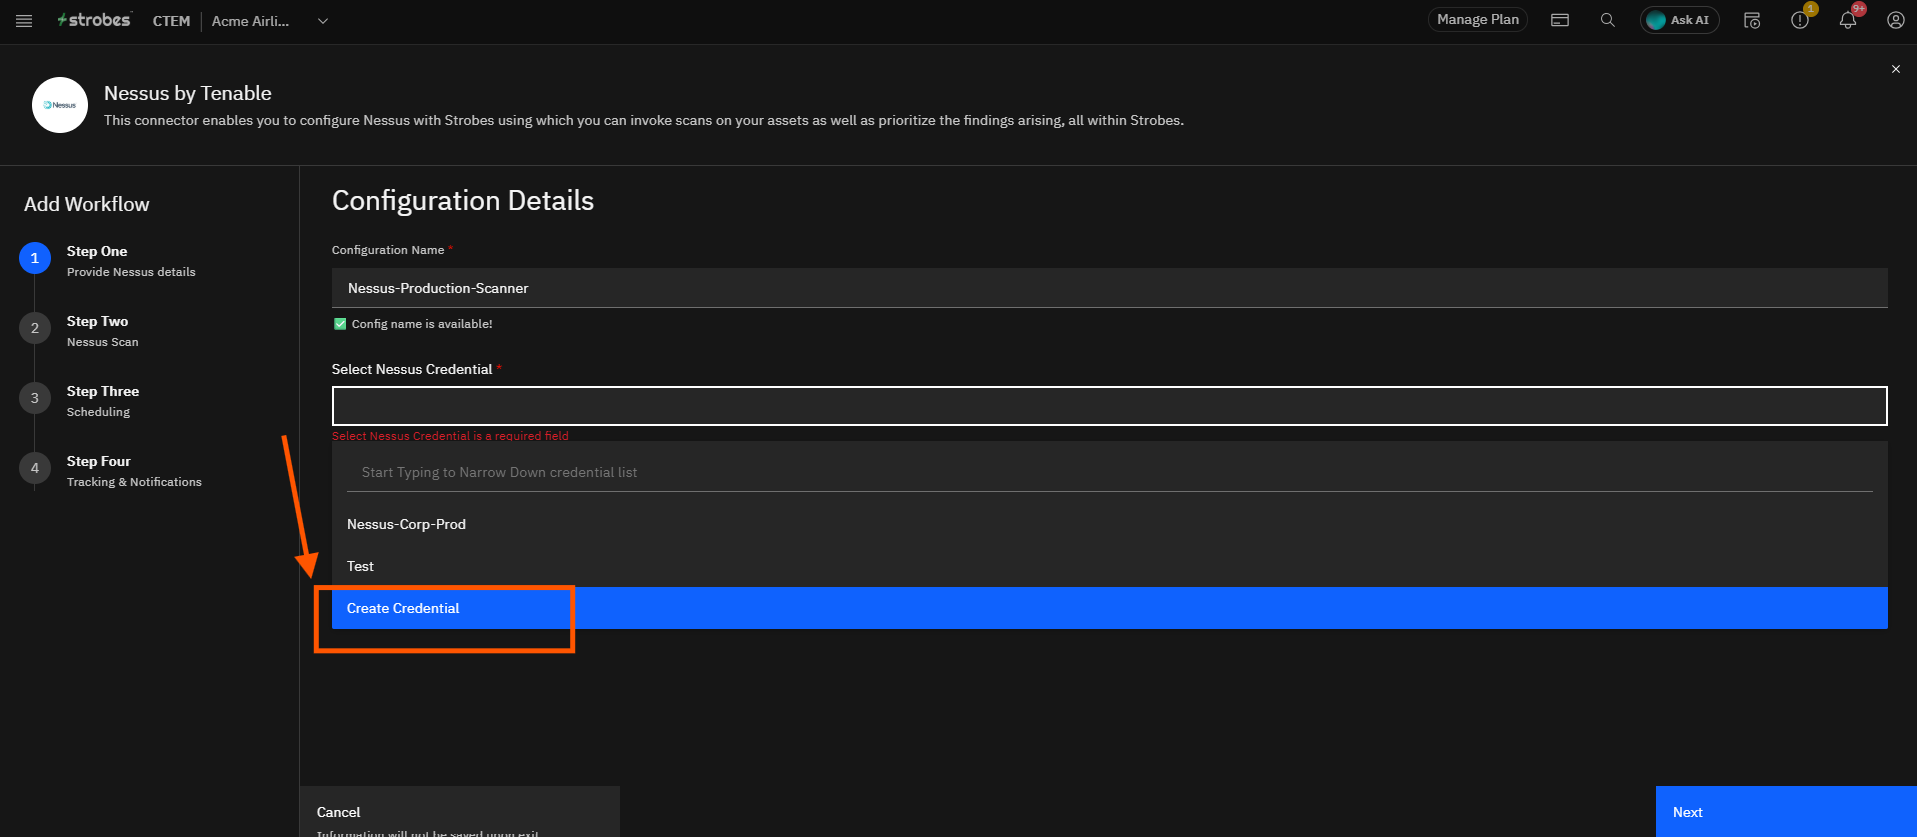
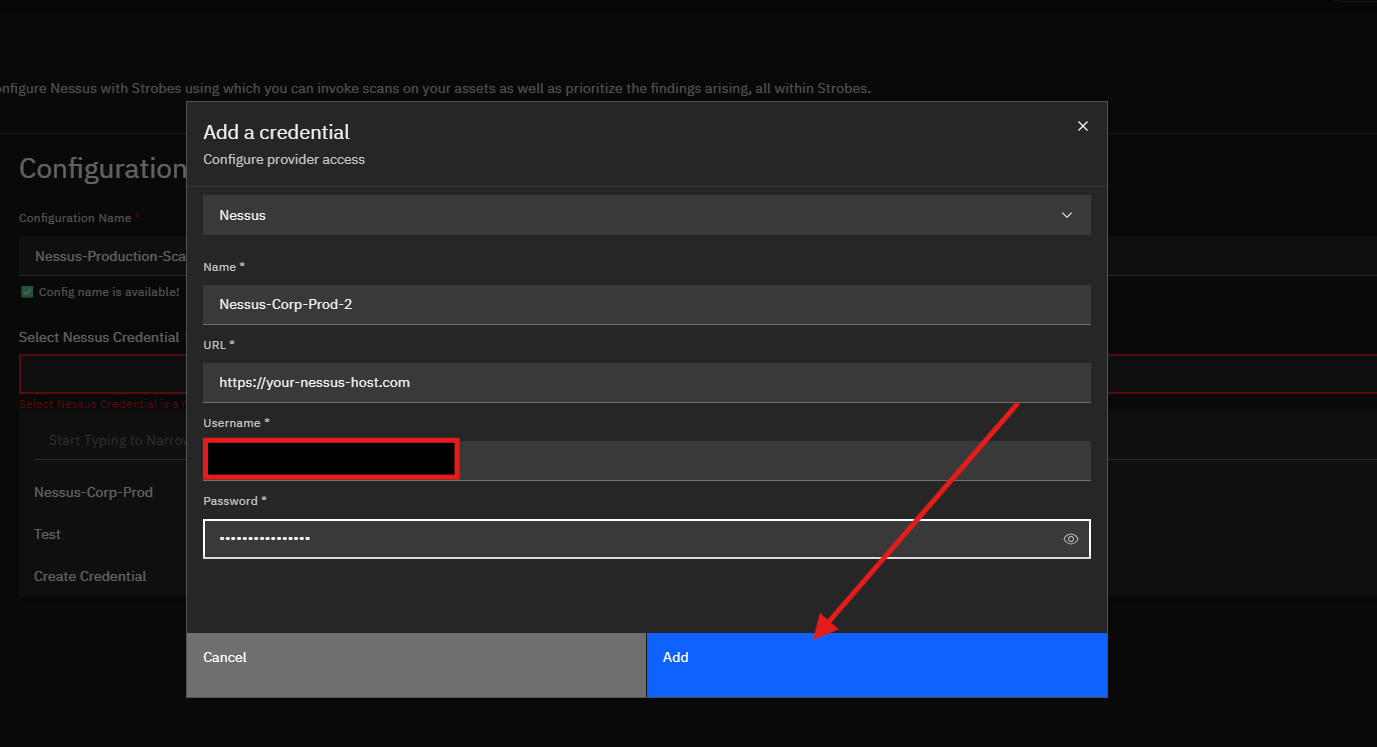
- Click Create Credential if you have not added a credential earlier in Credential Manager.
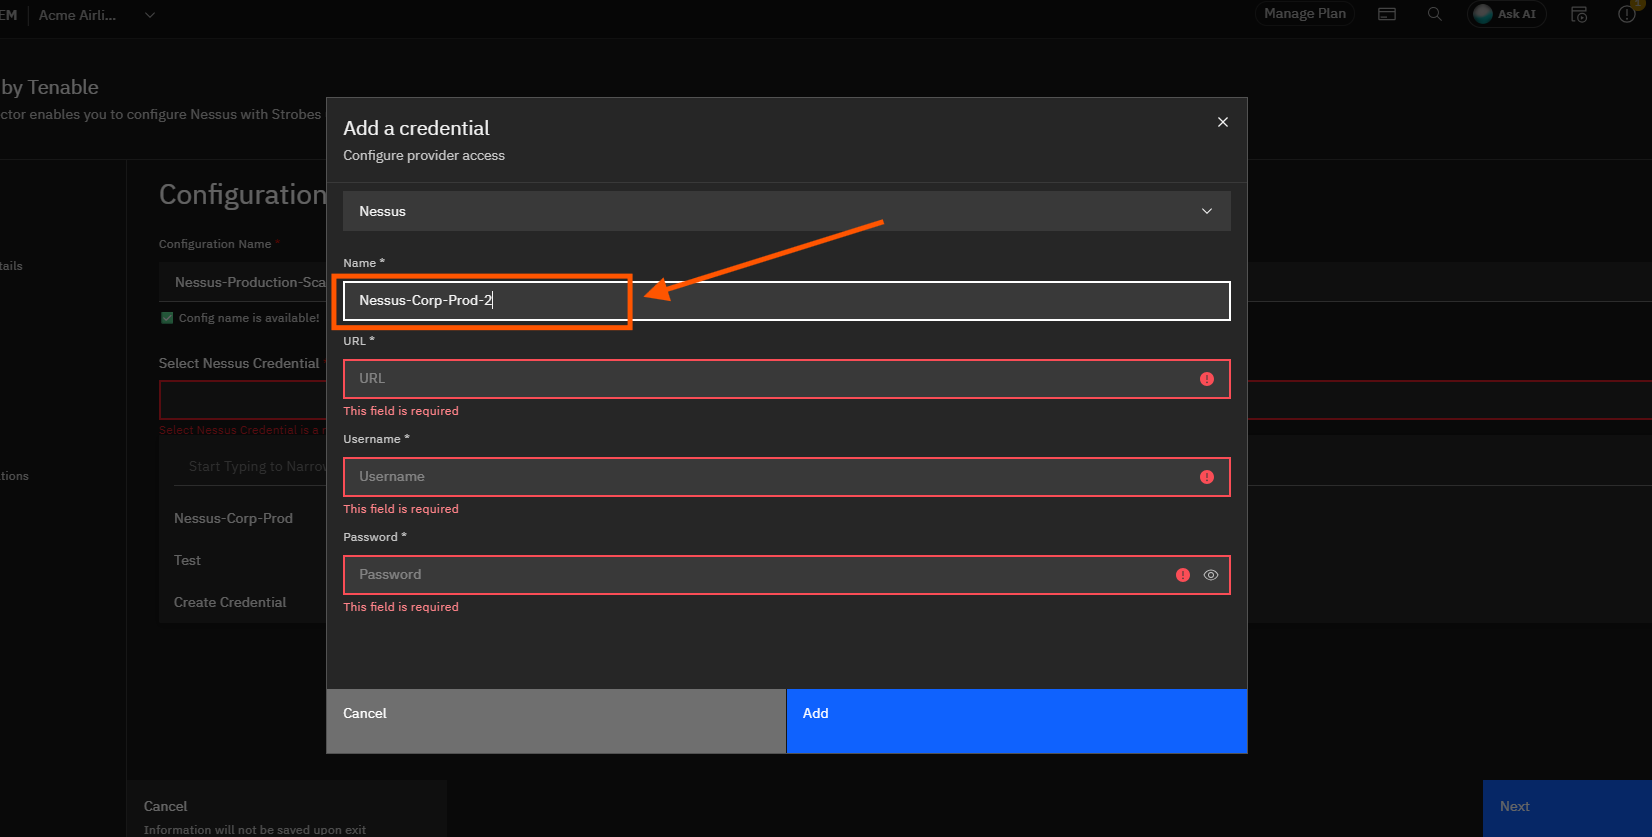
- In the Add a credential window, enter a Name for the credential.
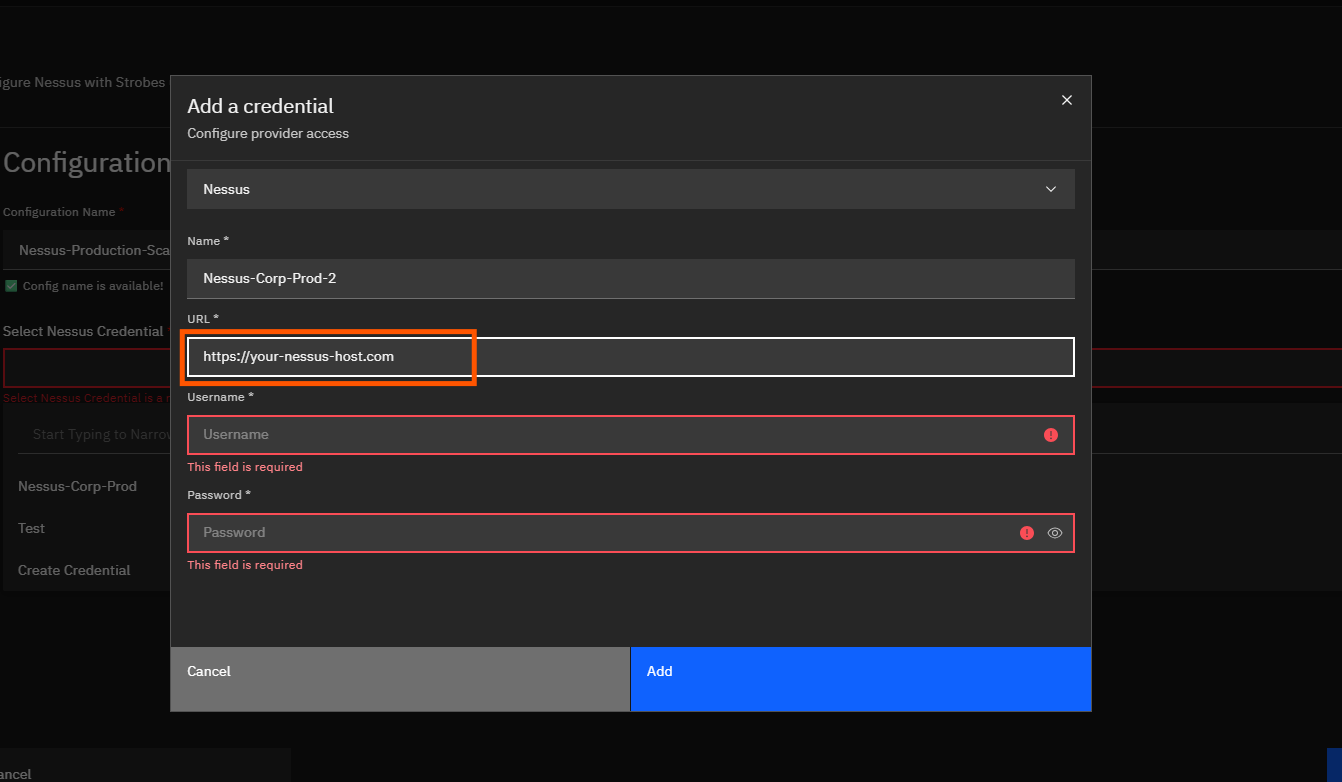
Example: Nessus-Corp-Prod-2 - Enter the URL of your Nessus server.
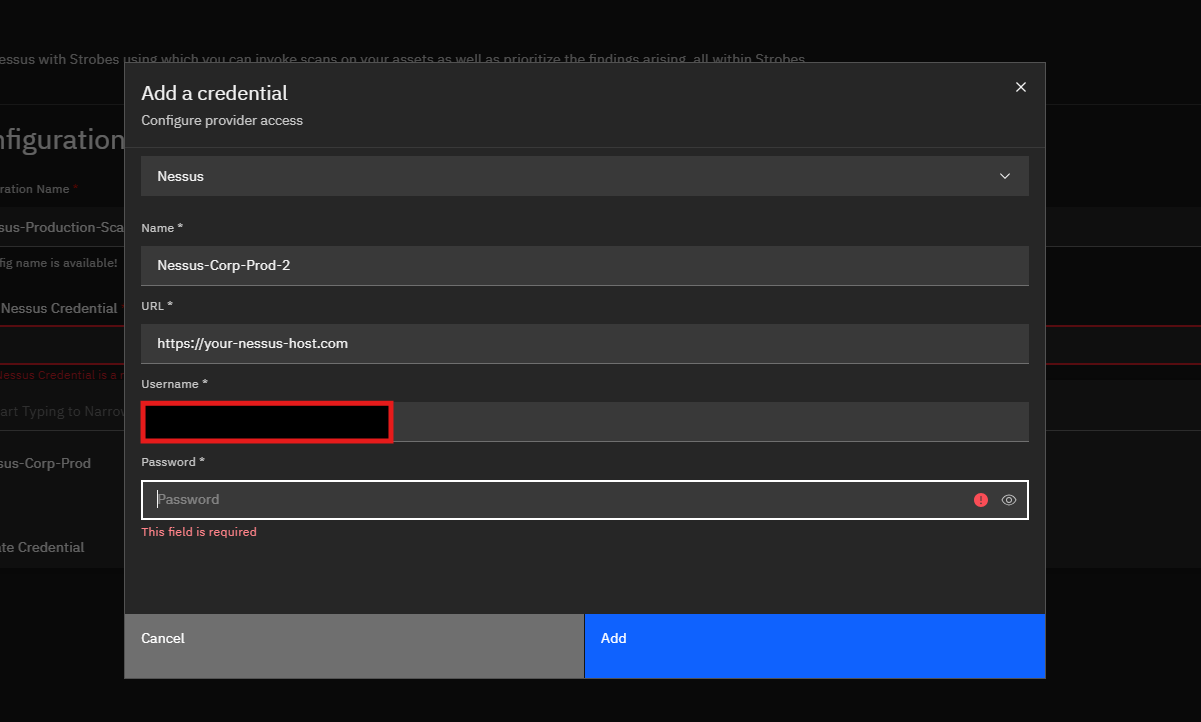
Example: https://<your-nessus-host>:8834 - Enter your Nessus Username.
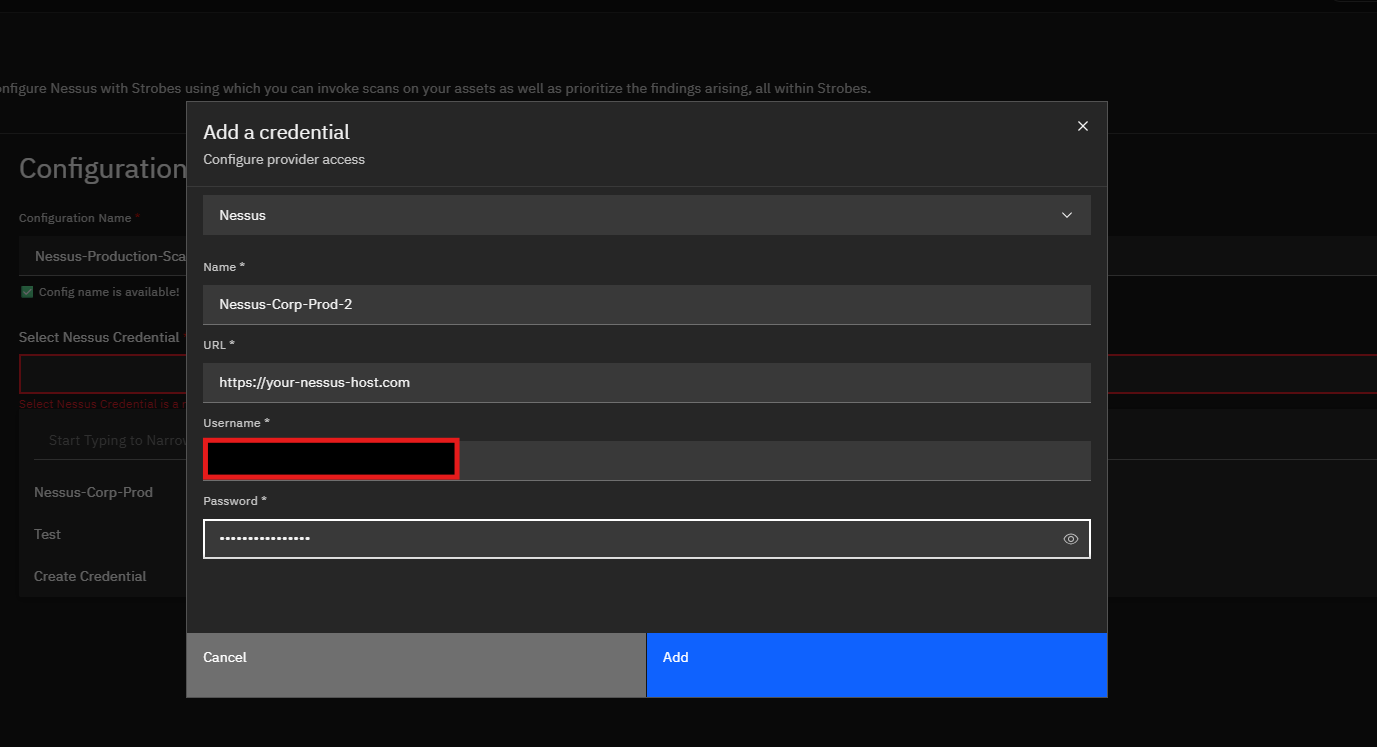
- Enter your Nessus Password.
- Click Add to save the credential.
- Select the credential you just created from the Select Nessus Credential dropdown.
- Click Next.
Step 4: Configure the Nessus Scan Settings
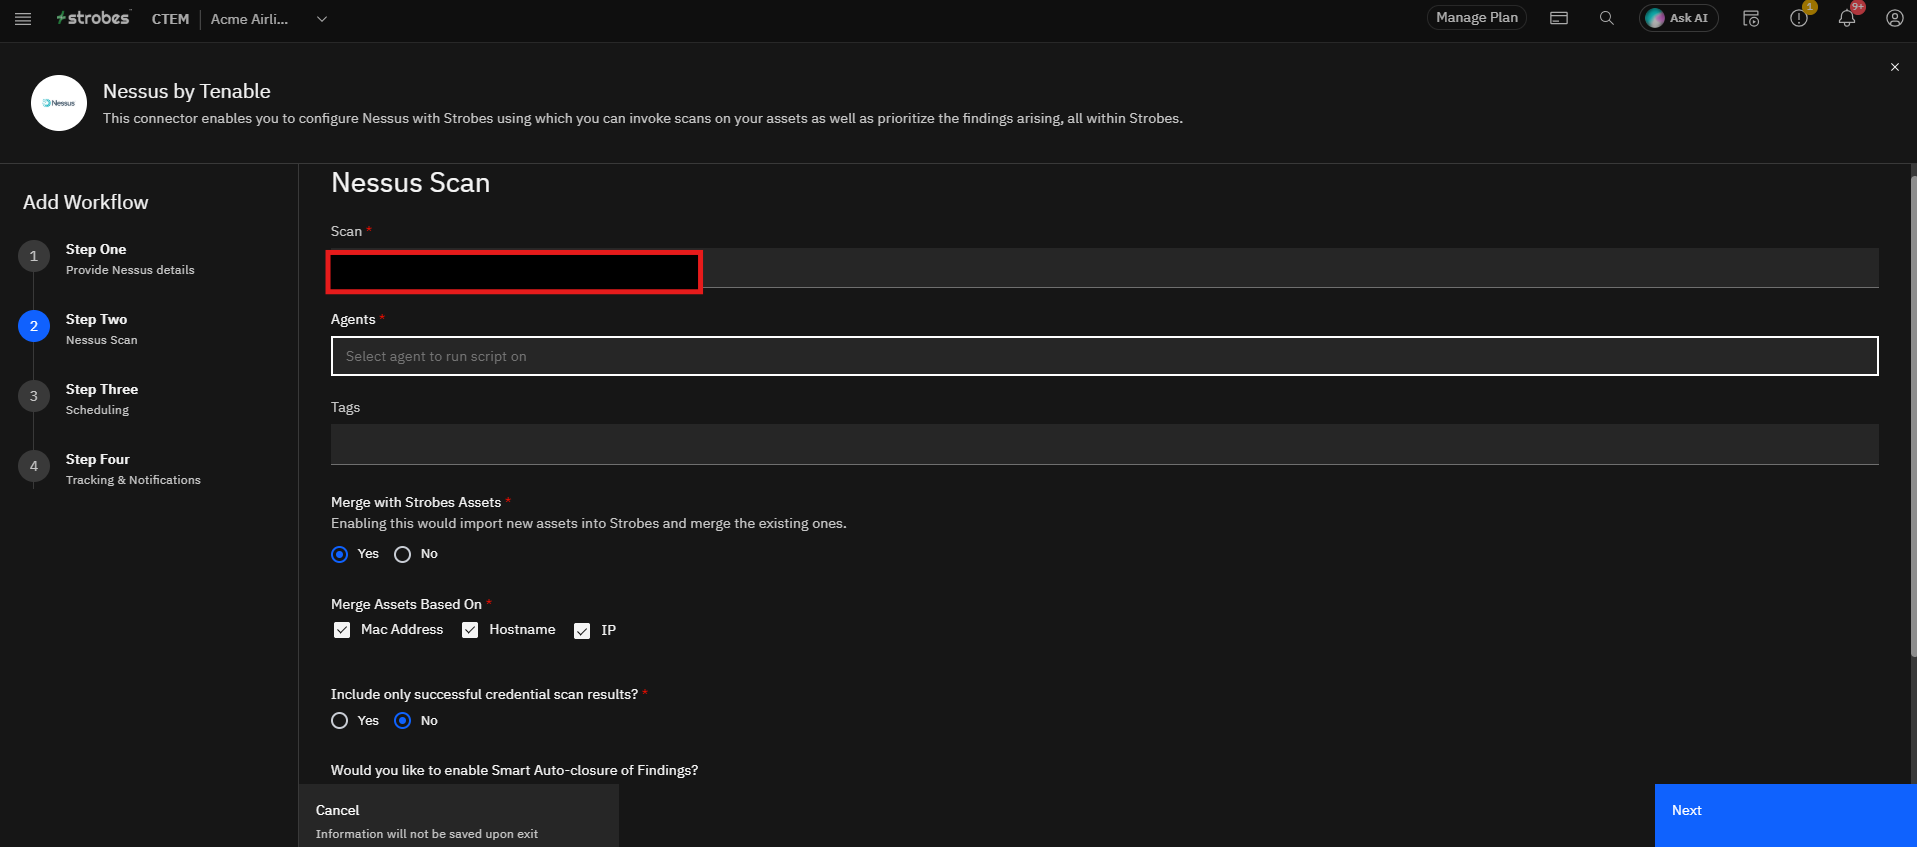
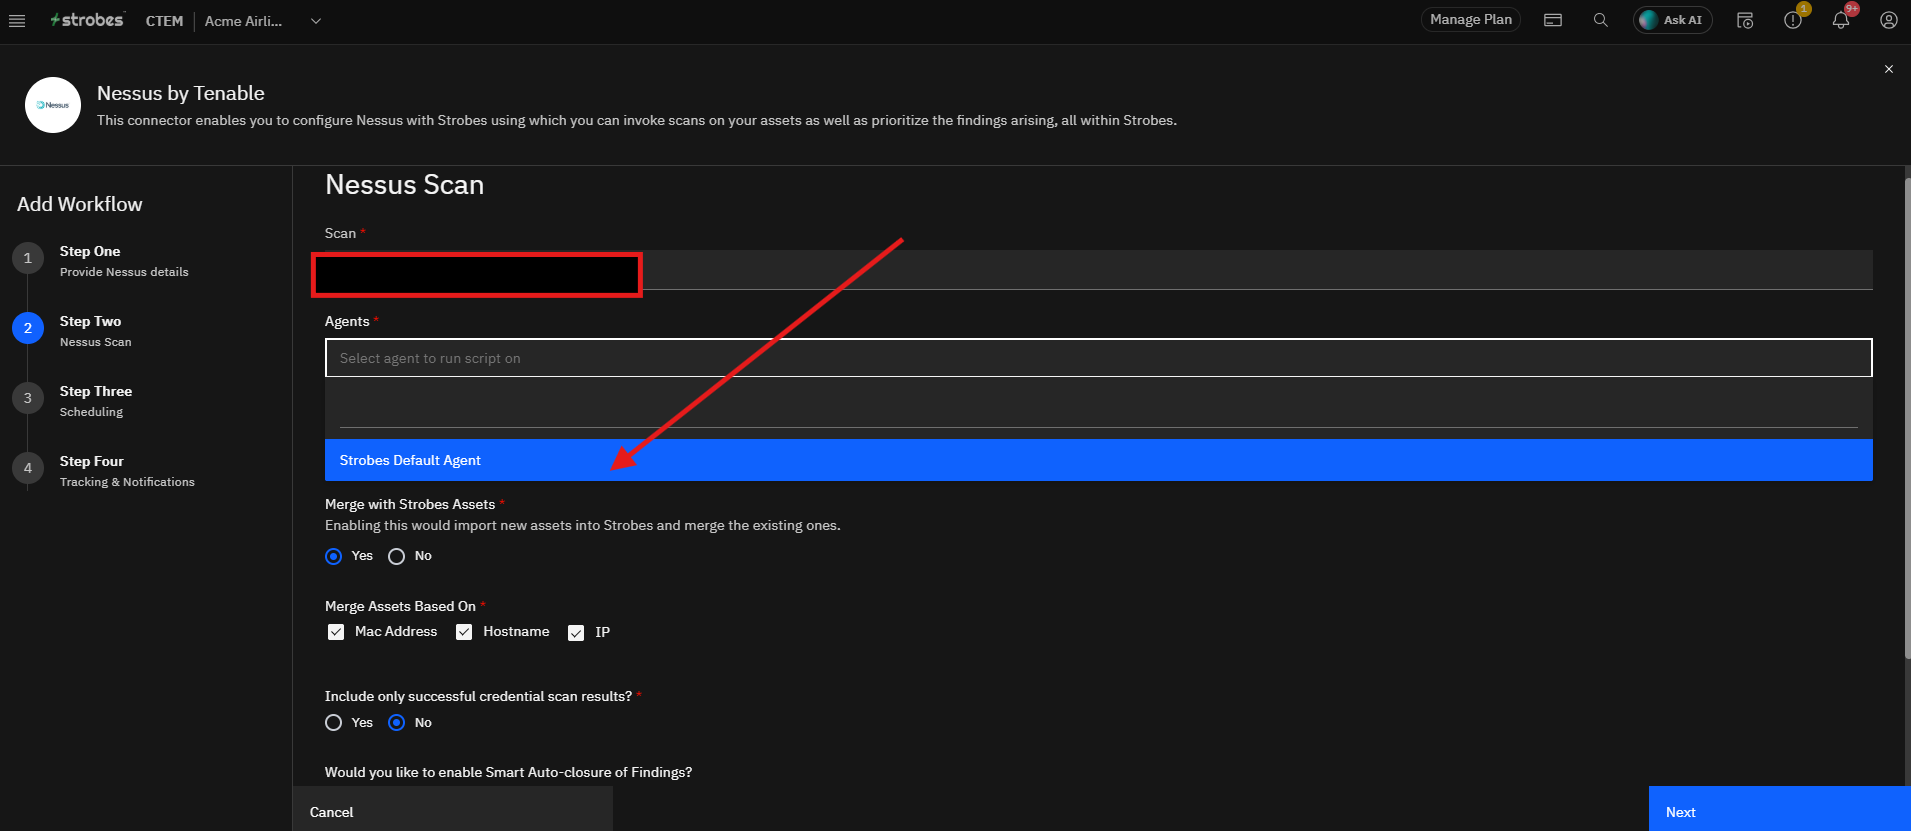
- In the Scan field, enter the numeric Scan ID from your Nessus console.
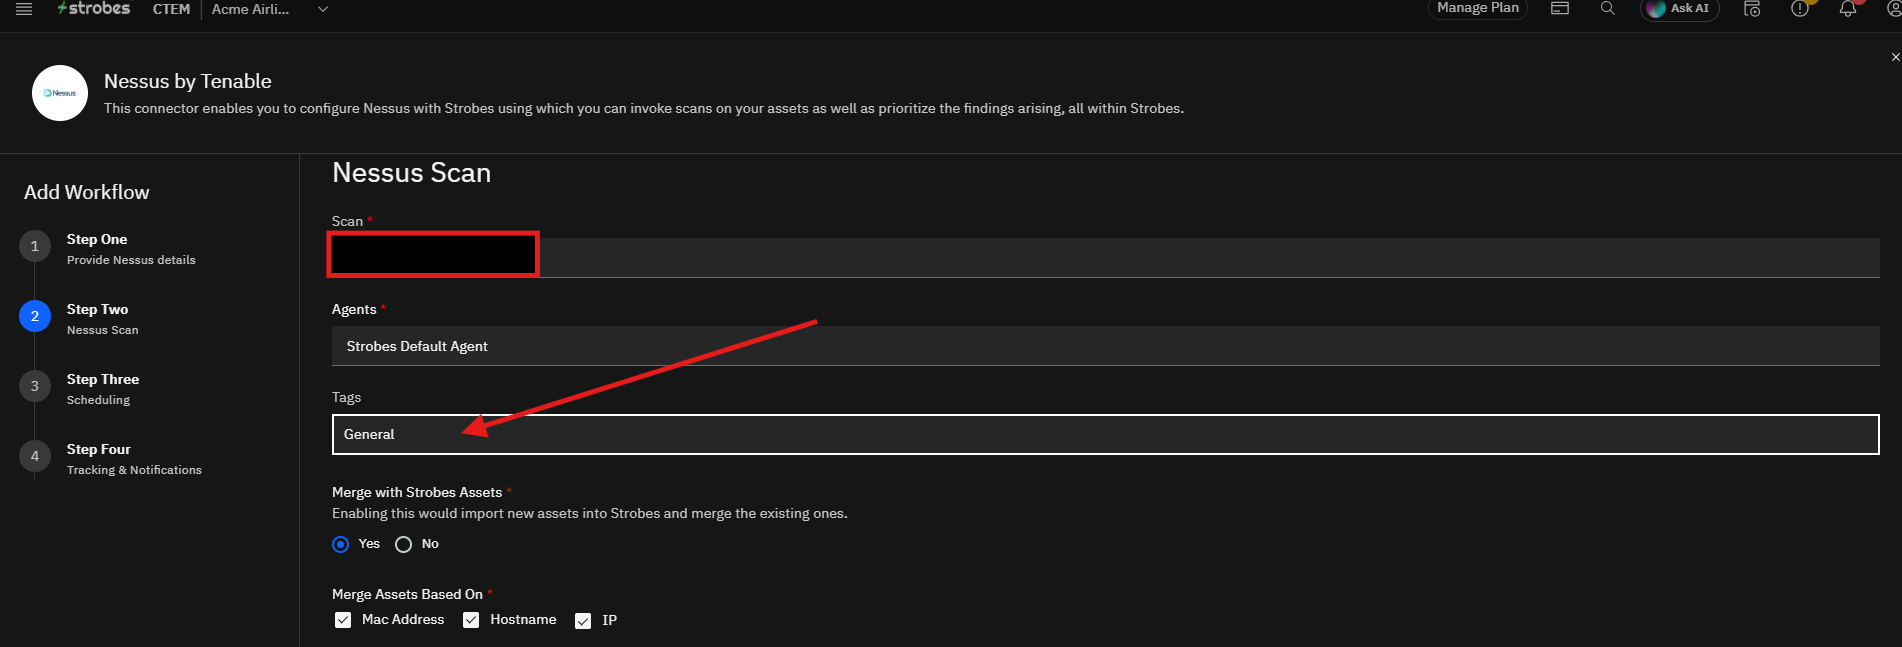
- In Agents, select the agent that should run this sync, e.g., Strobes Default Agent.
- (Optional) Add any Tags to help organize this workflow.
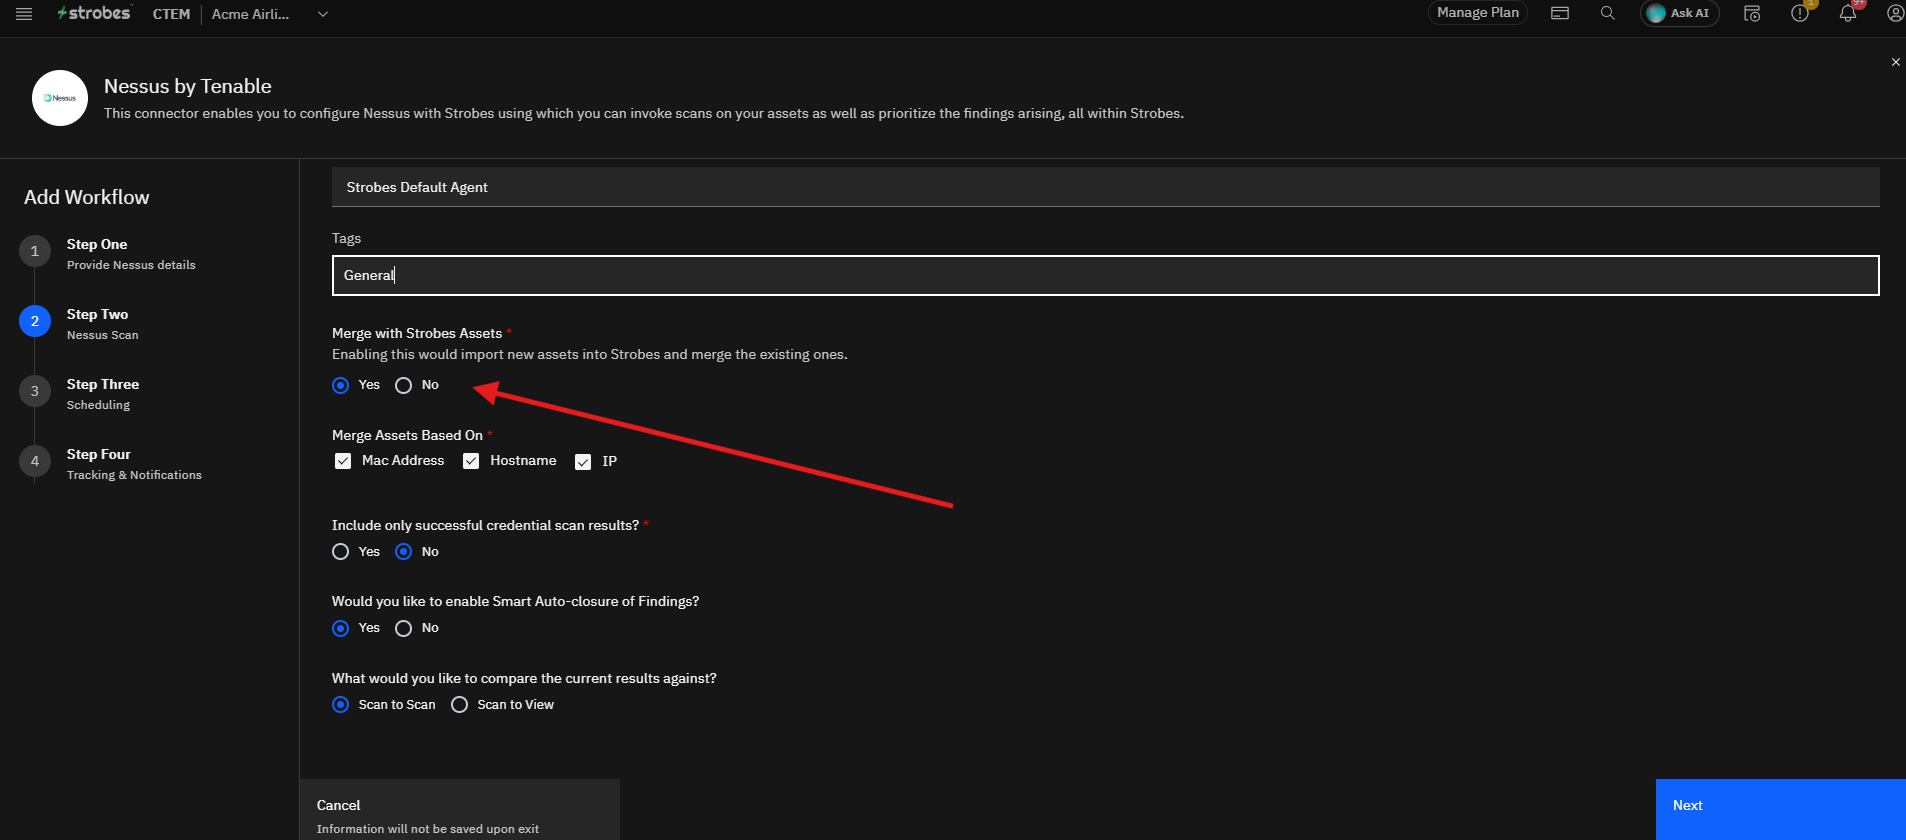
- Under Merge with Strobes Assets, choose Yes or No.
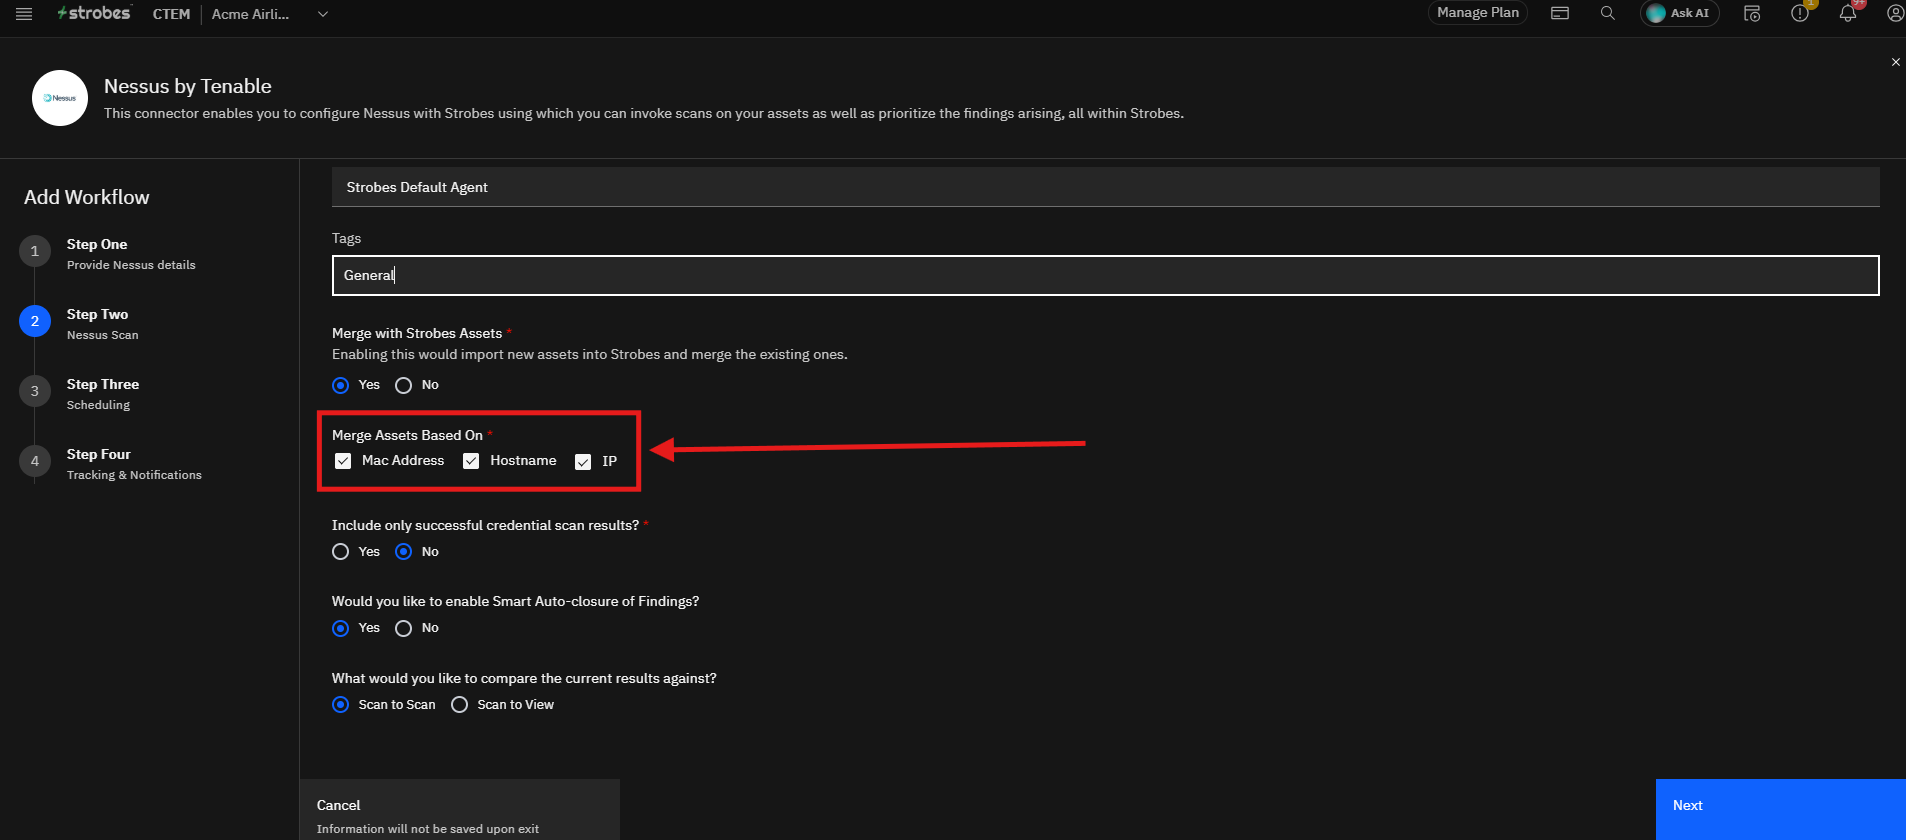
- Under Merge Assets Based On, select Mac Address, Hostname, and/or IP.
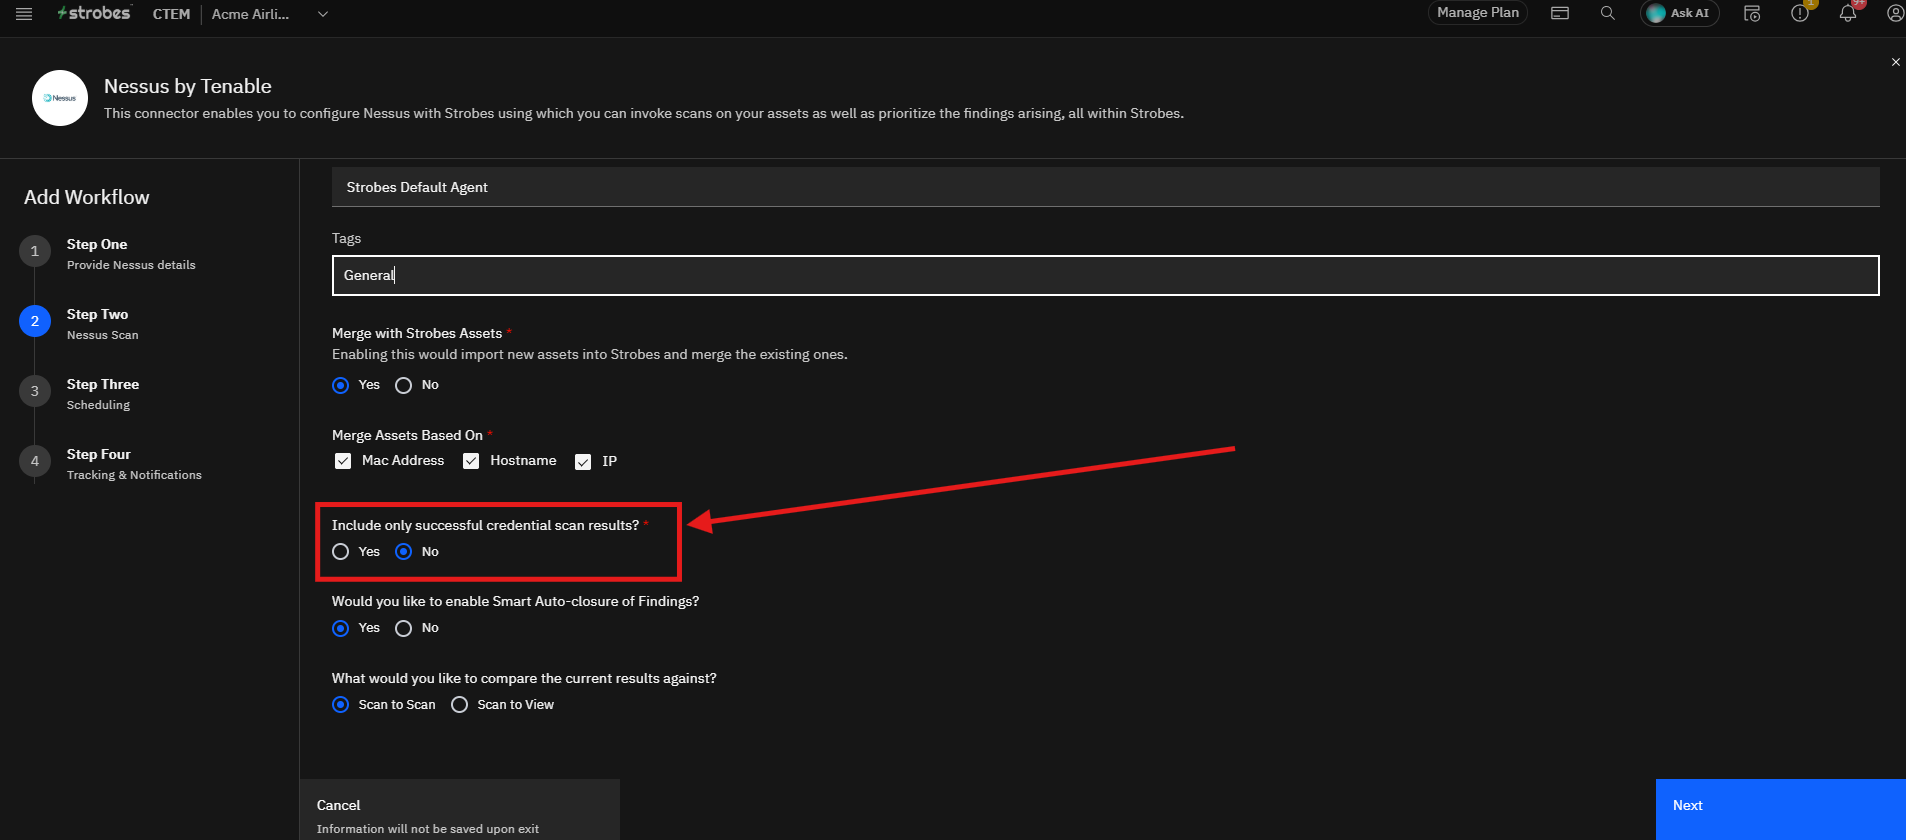
- Under Include only successful credential scan results?, choose Yes or No.
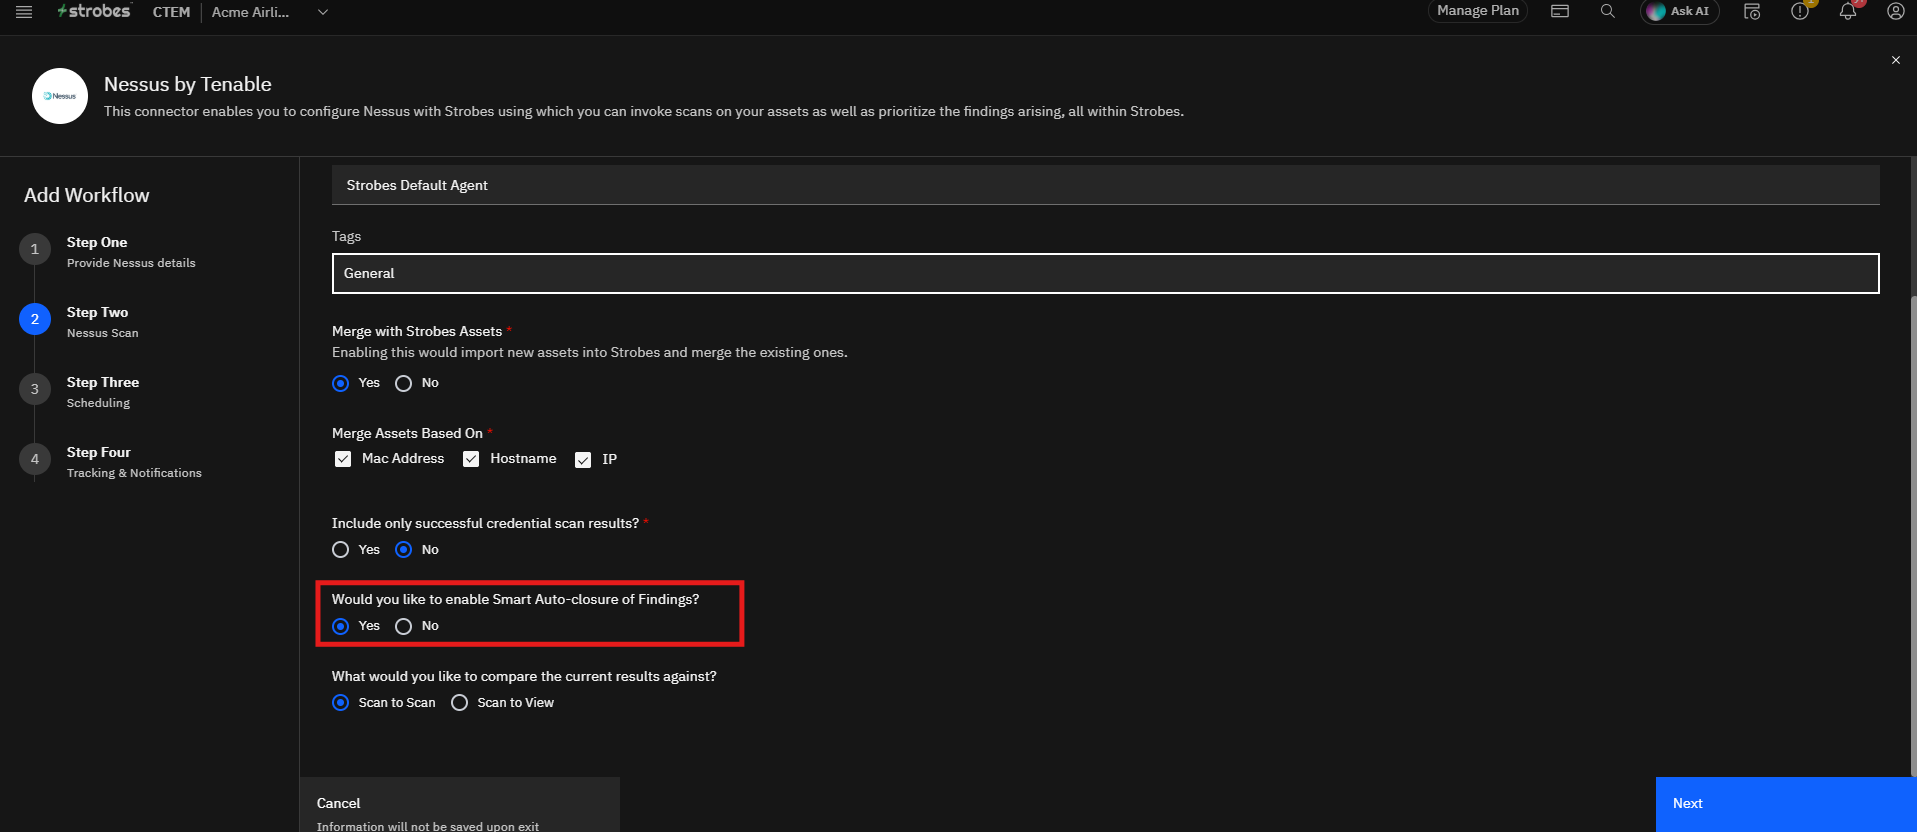
- Under Would you like to enable Smart Auto-closure of Findings?, choose Yes or No.
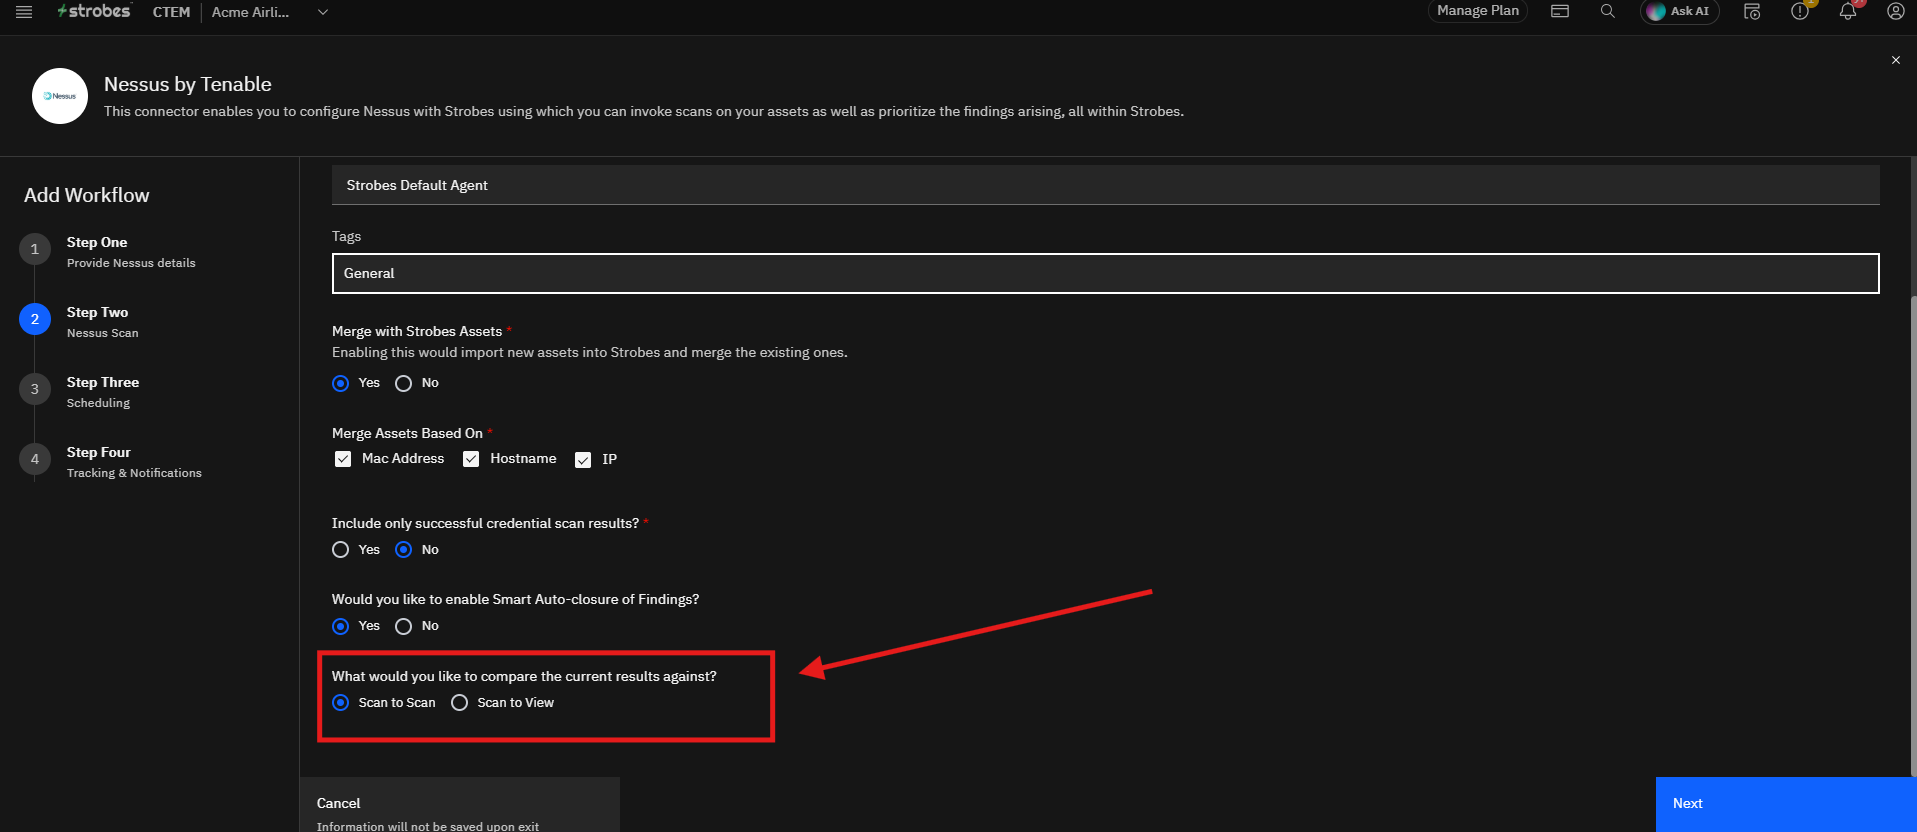
- Under What would you like to compare the current results against?, choose Scan to Scan or Scan to View.
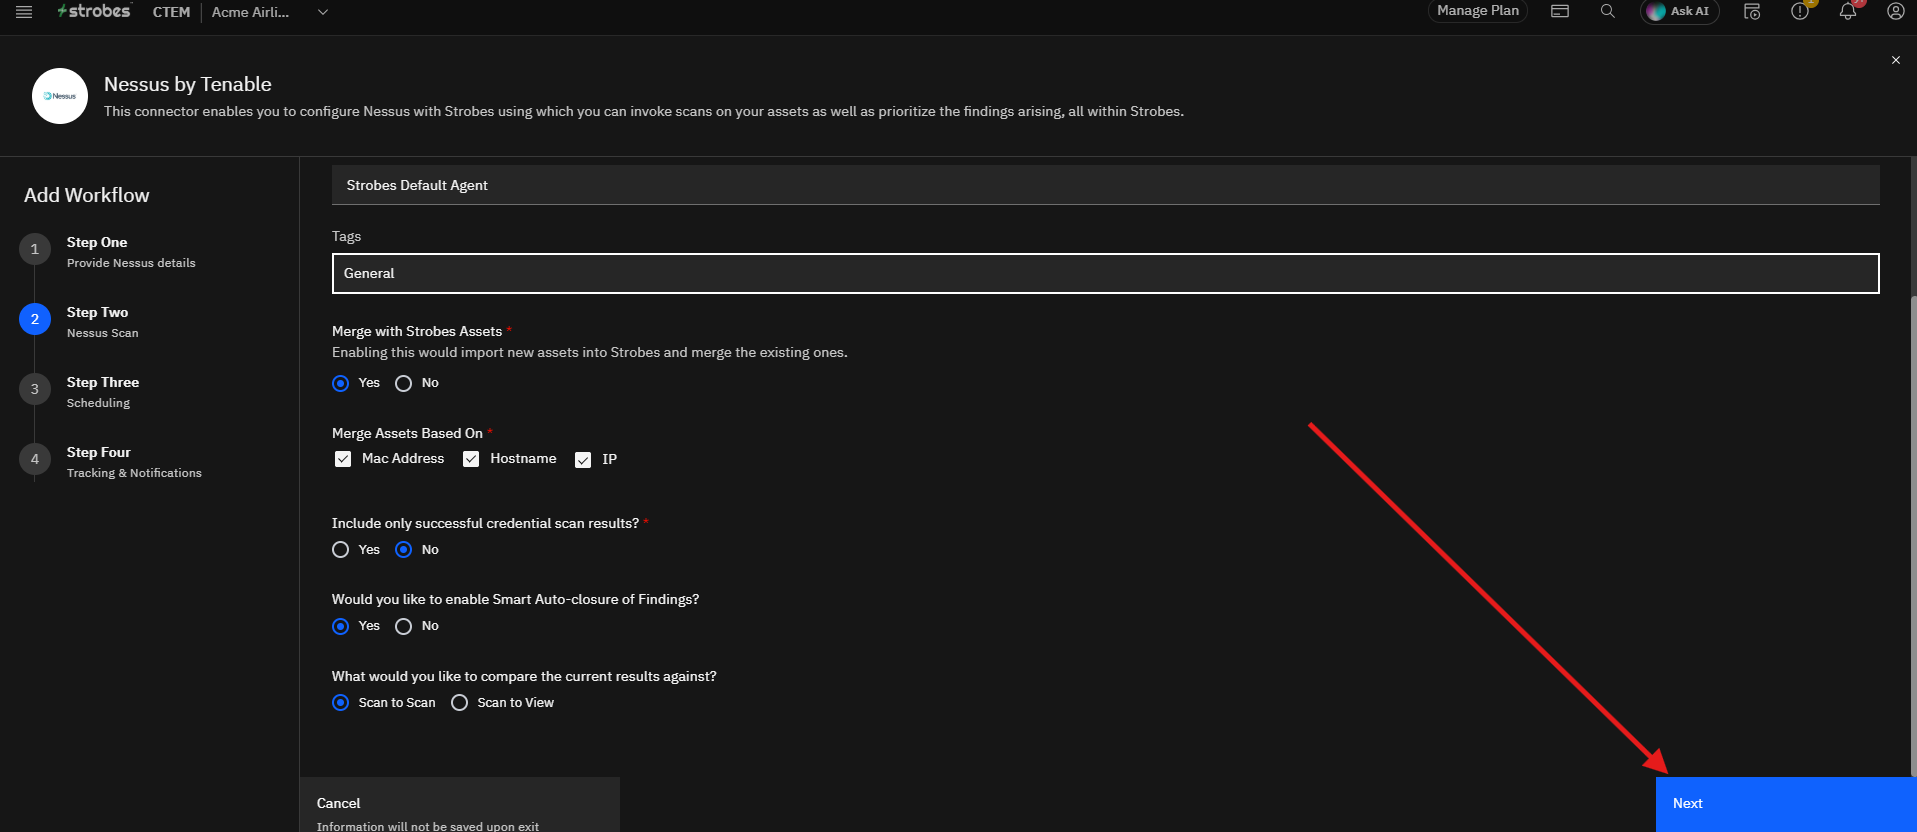
- Click Next.
Step 5: Set Your Sync Schedule
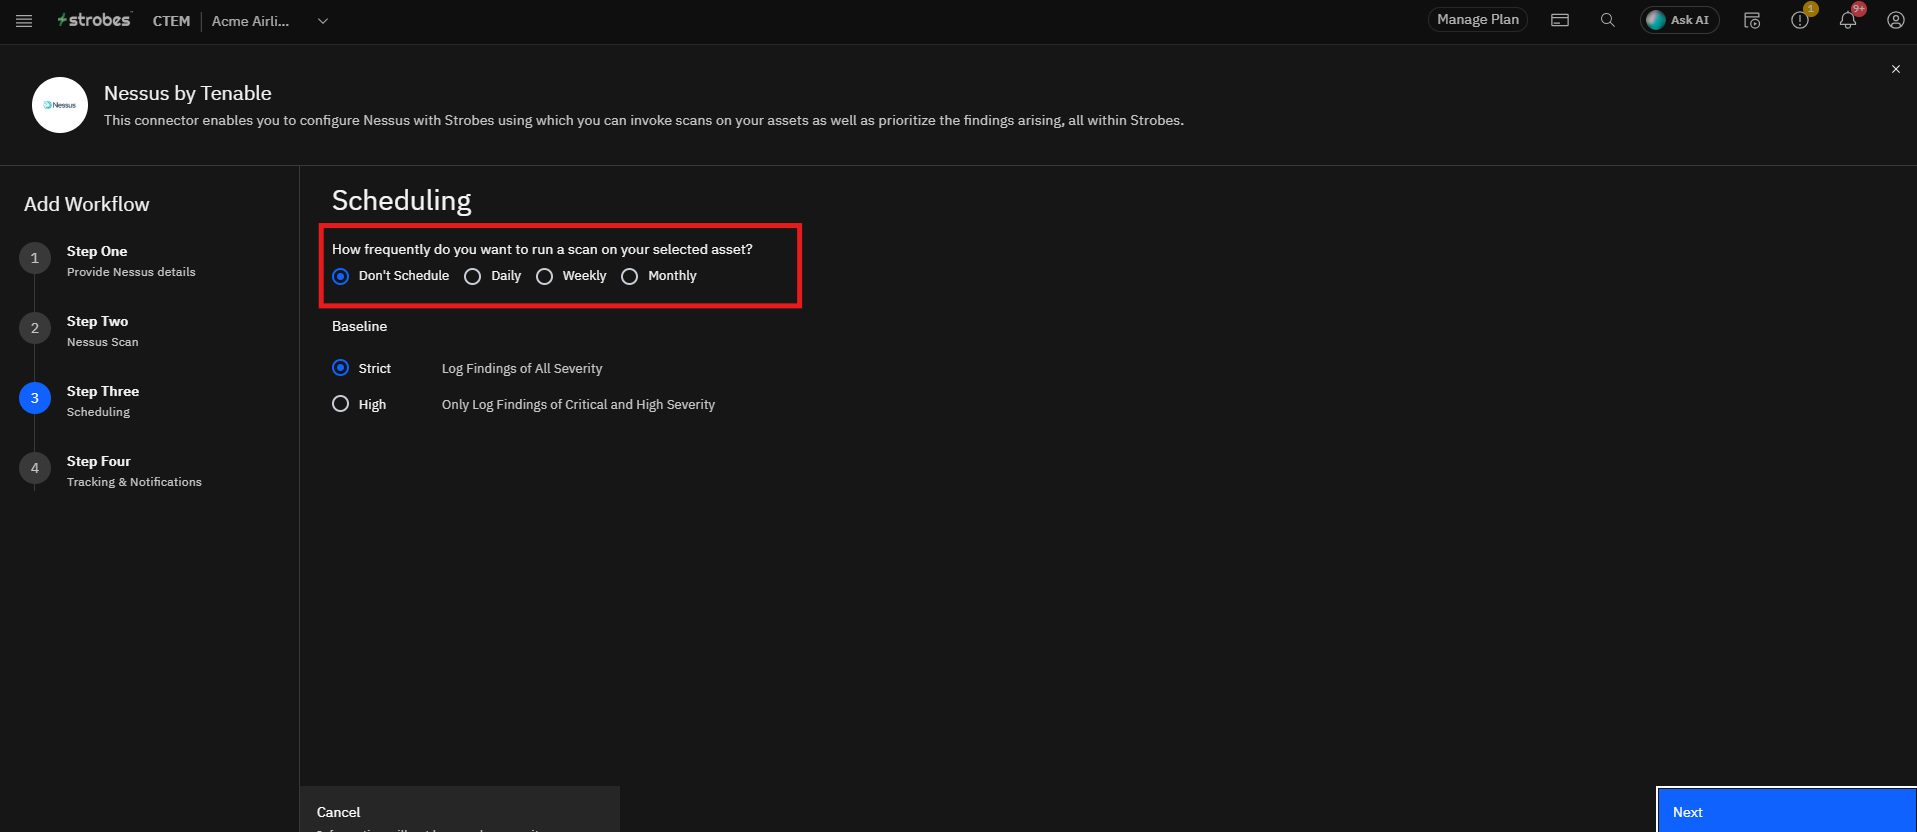
- Under How frequently do you want to run a scan on your selected asset?, choose Don't Schedule, Daily, Weekly, or Monthly.
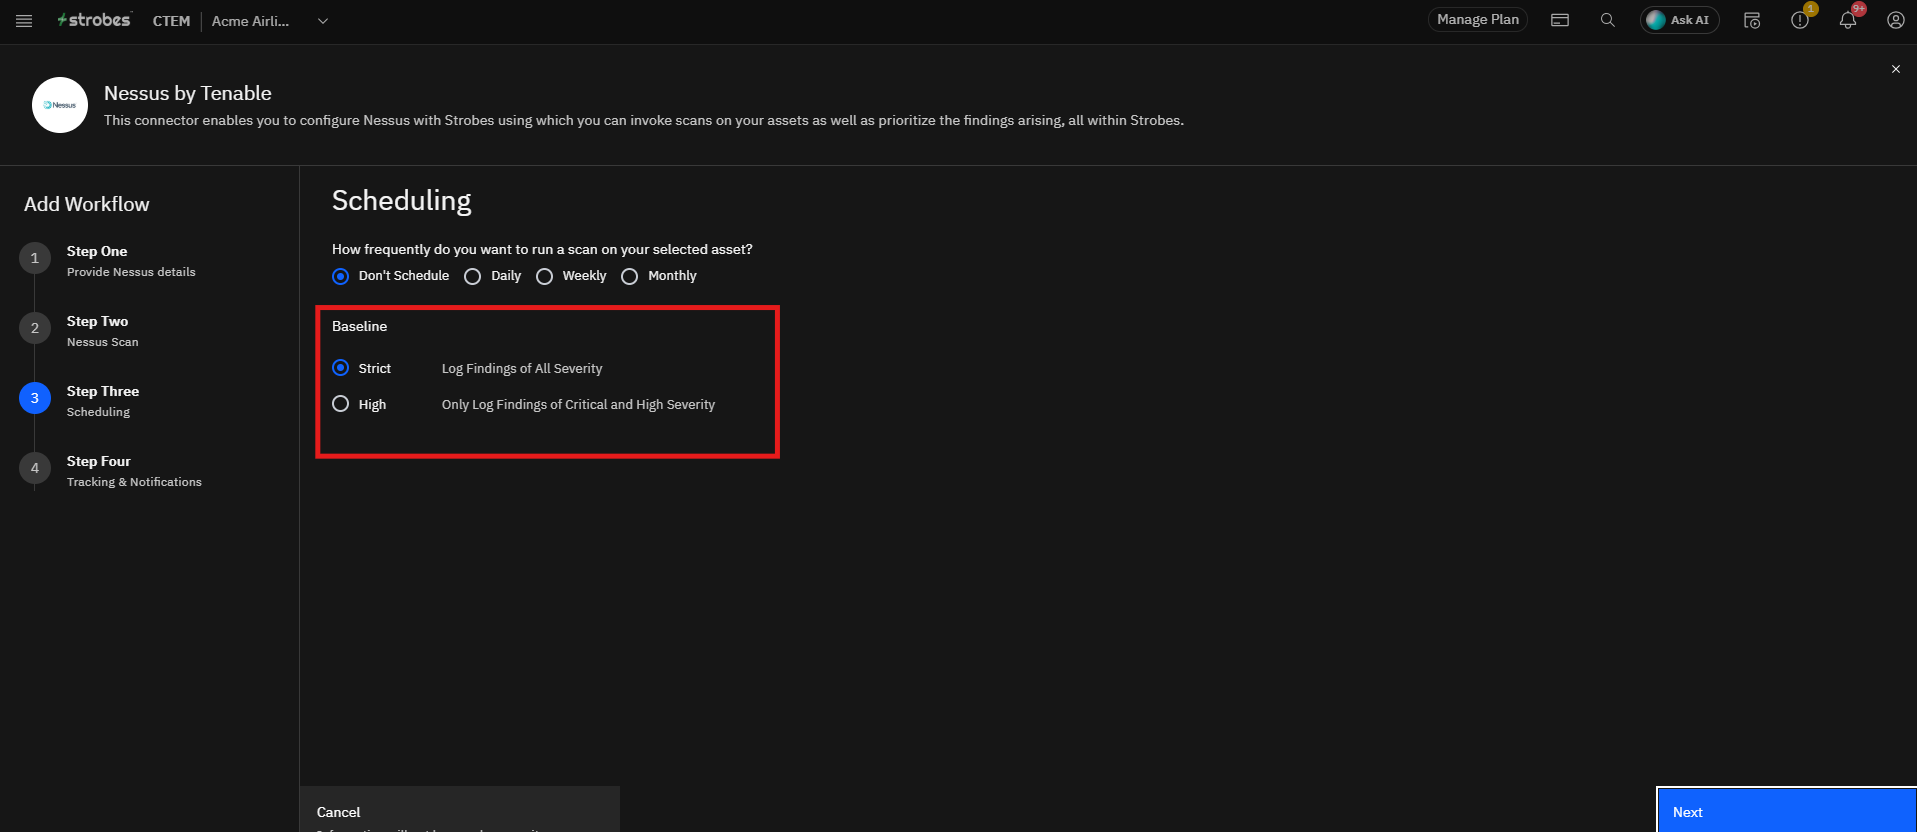
- Under Baseline, choose Strict (logs findings of all severities) or High (only logs Critical and High findings).
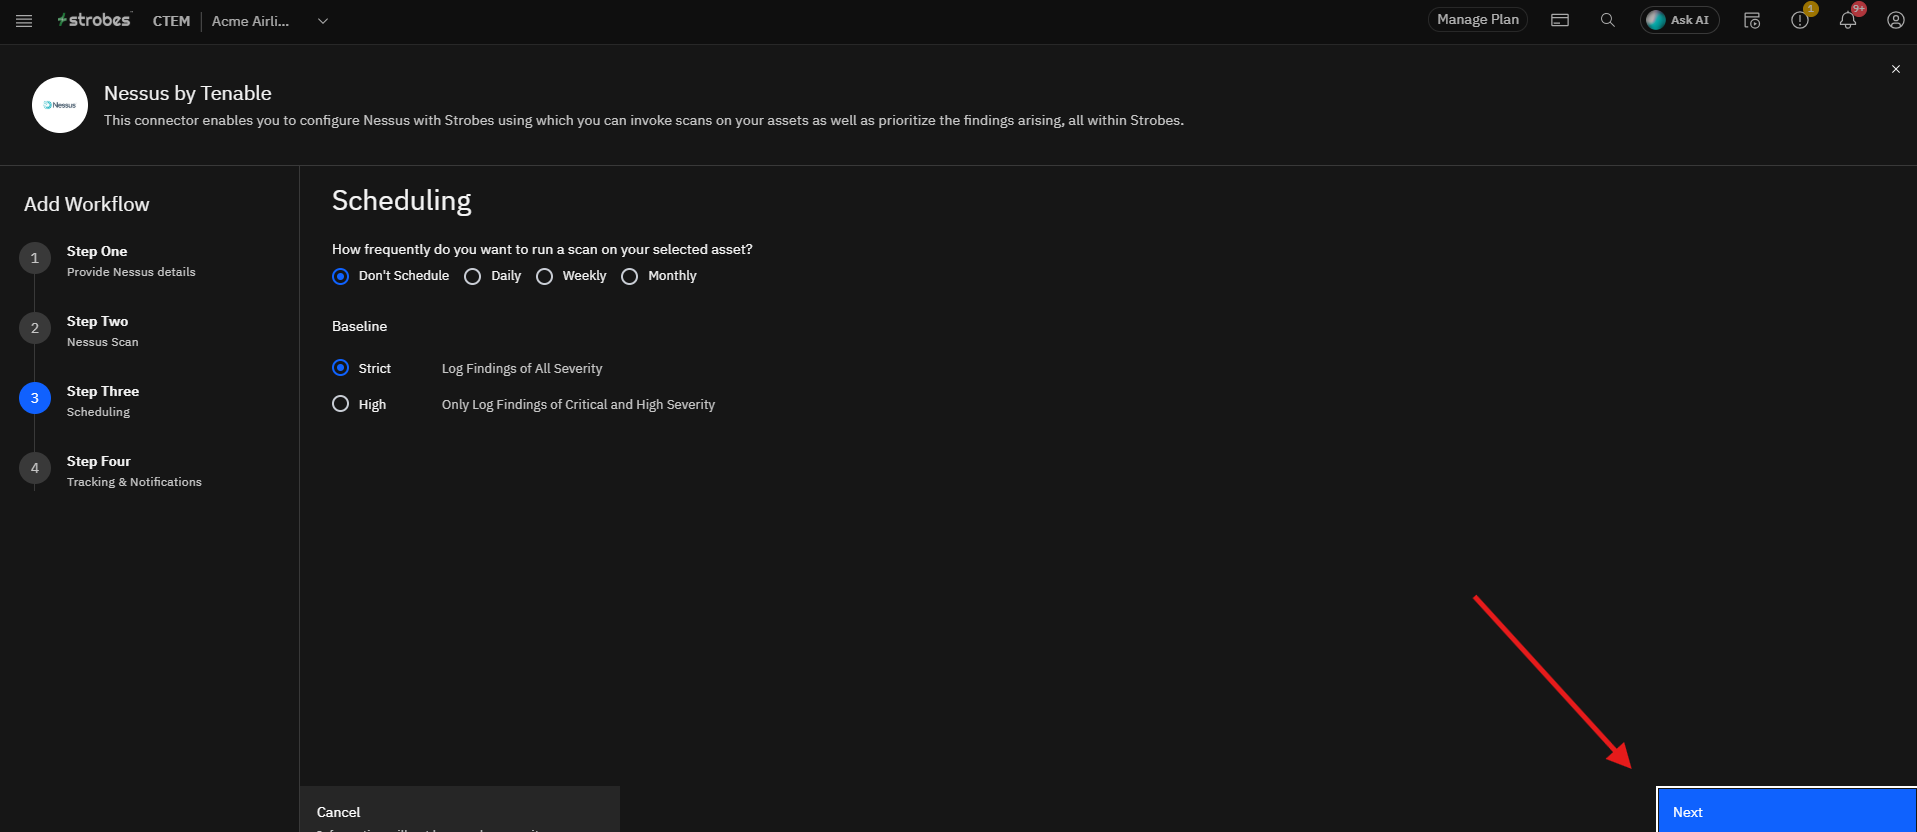
- Click Next.
Step 6: Connect Ticketing & Notification Platforms
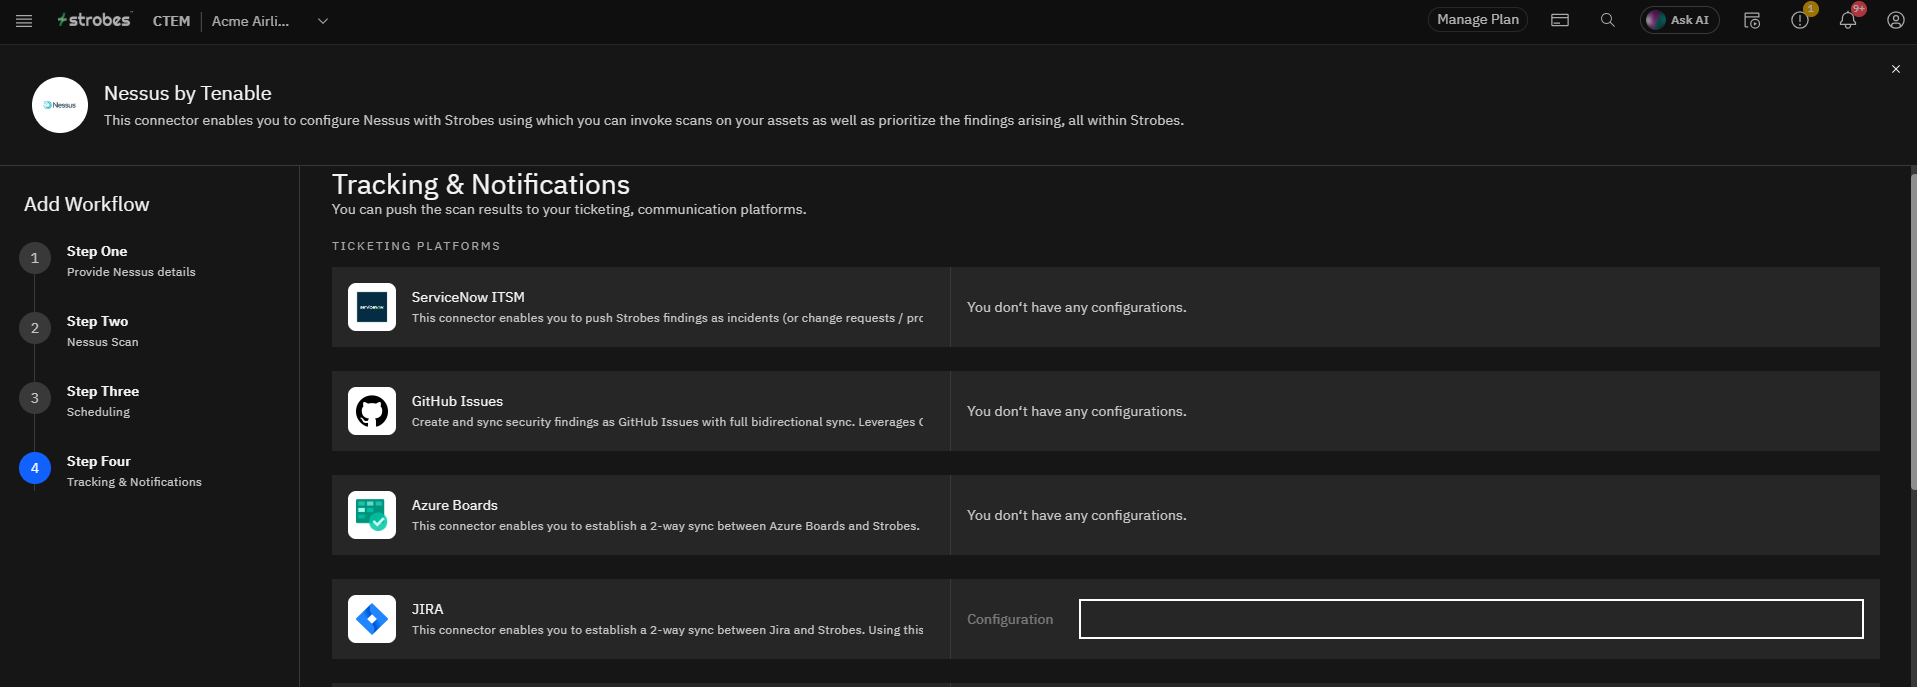
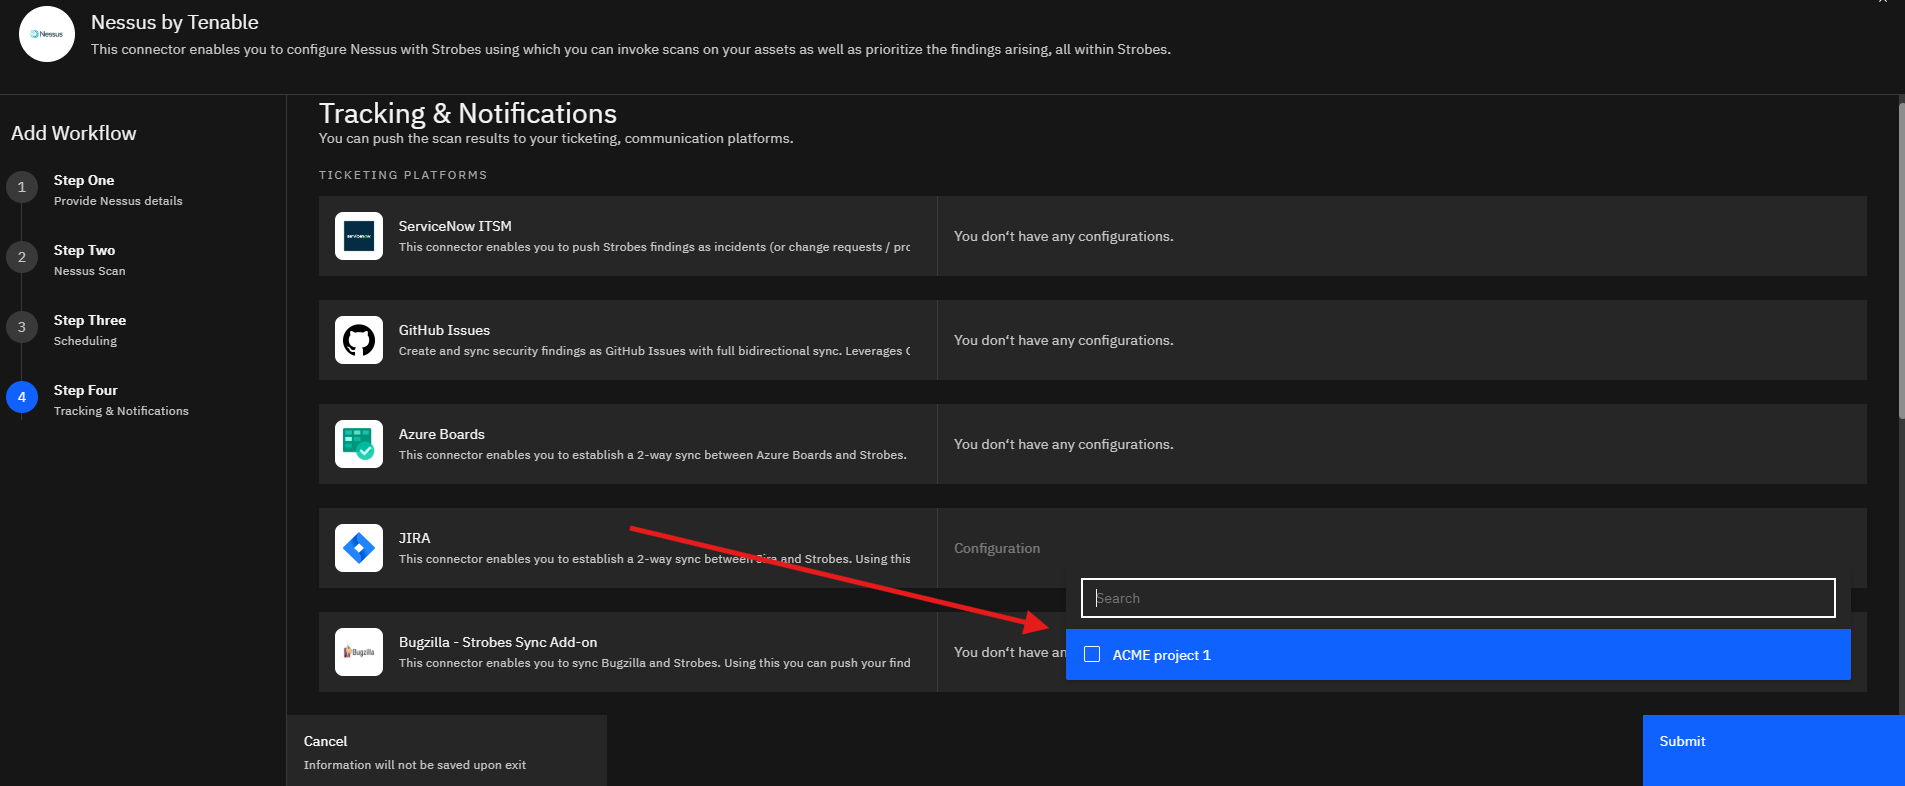
- Review the Tracking & Notifications screen, which lists ServiceNow ITSM, GitHub Issues, Azure Boards, and Jira.
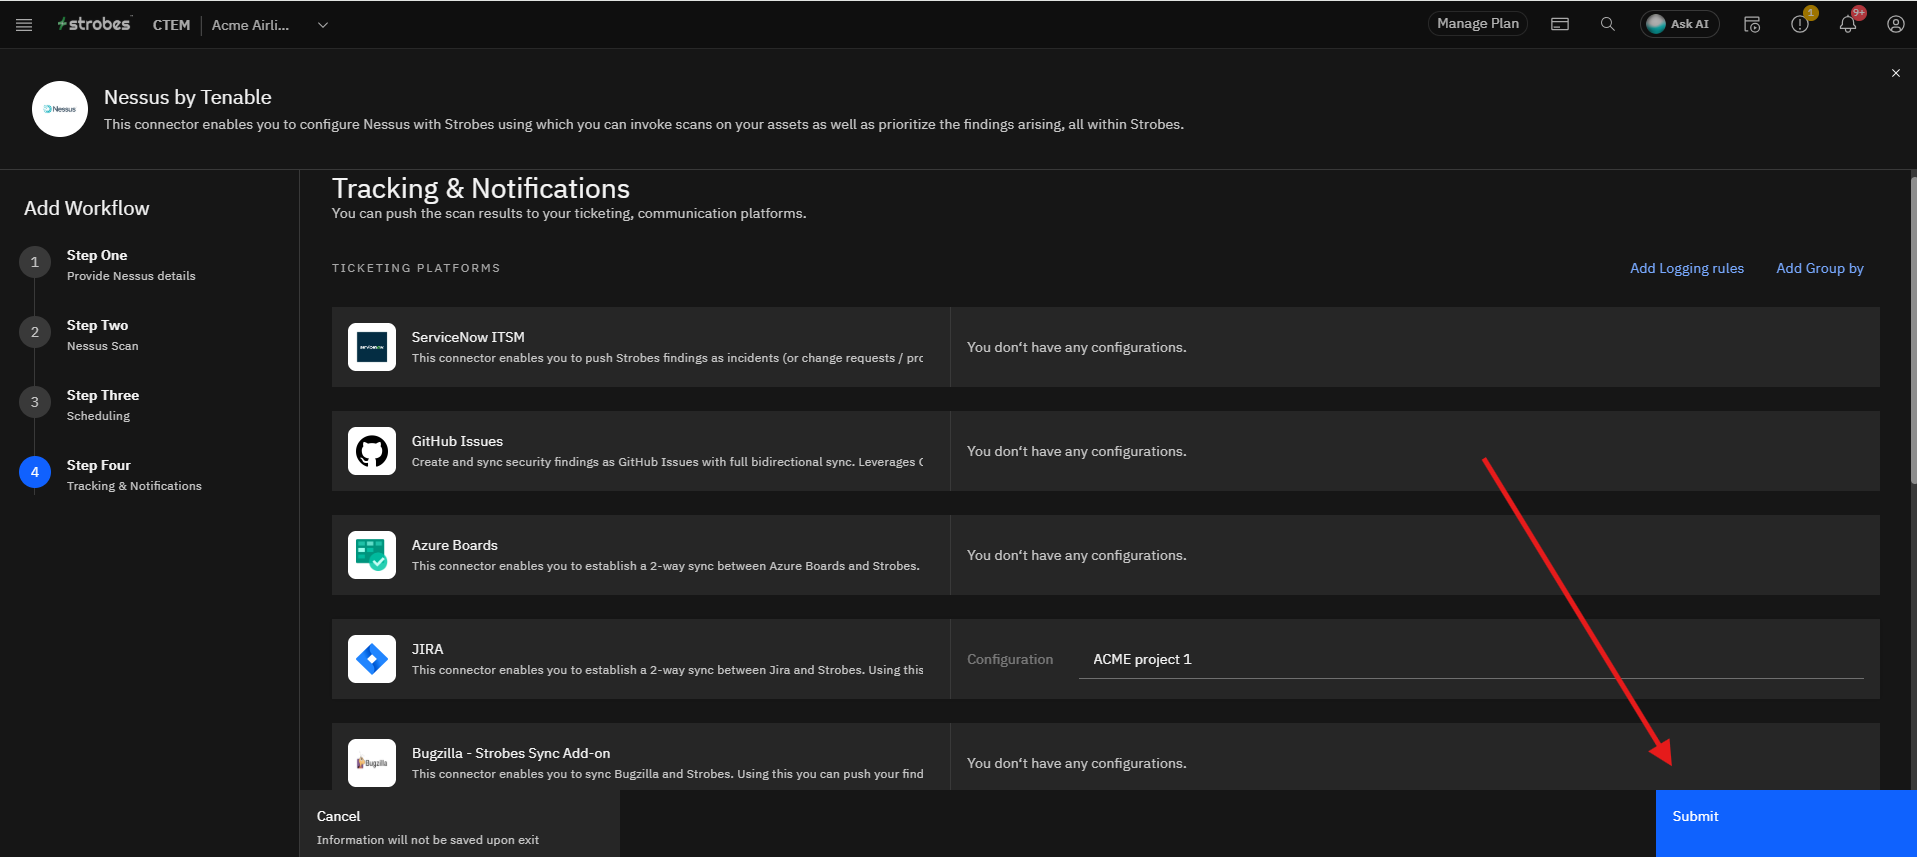
- If you already have one of these connectors configured, select it from the dropdown next to that platform. Otherwise, skip this step.
- Click Submit.
Step 7: Sync Your Nessus Data
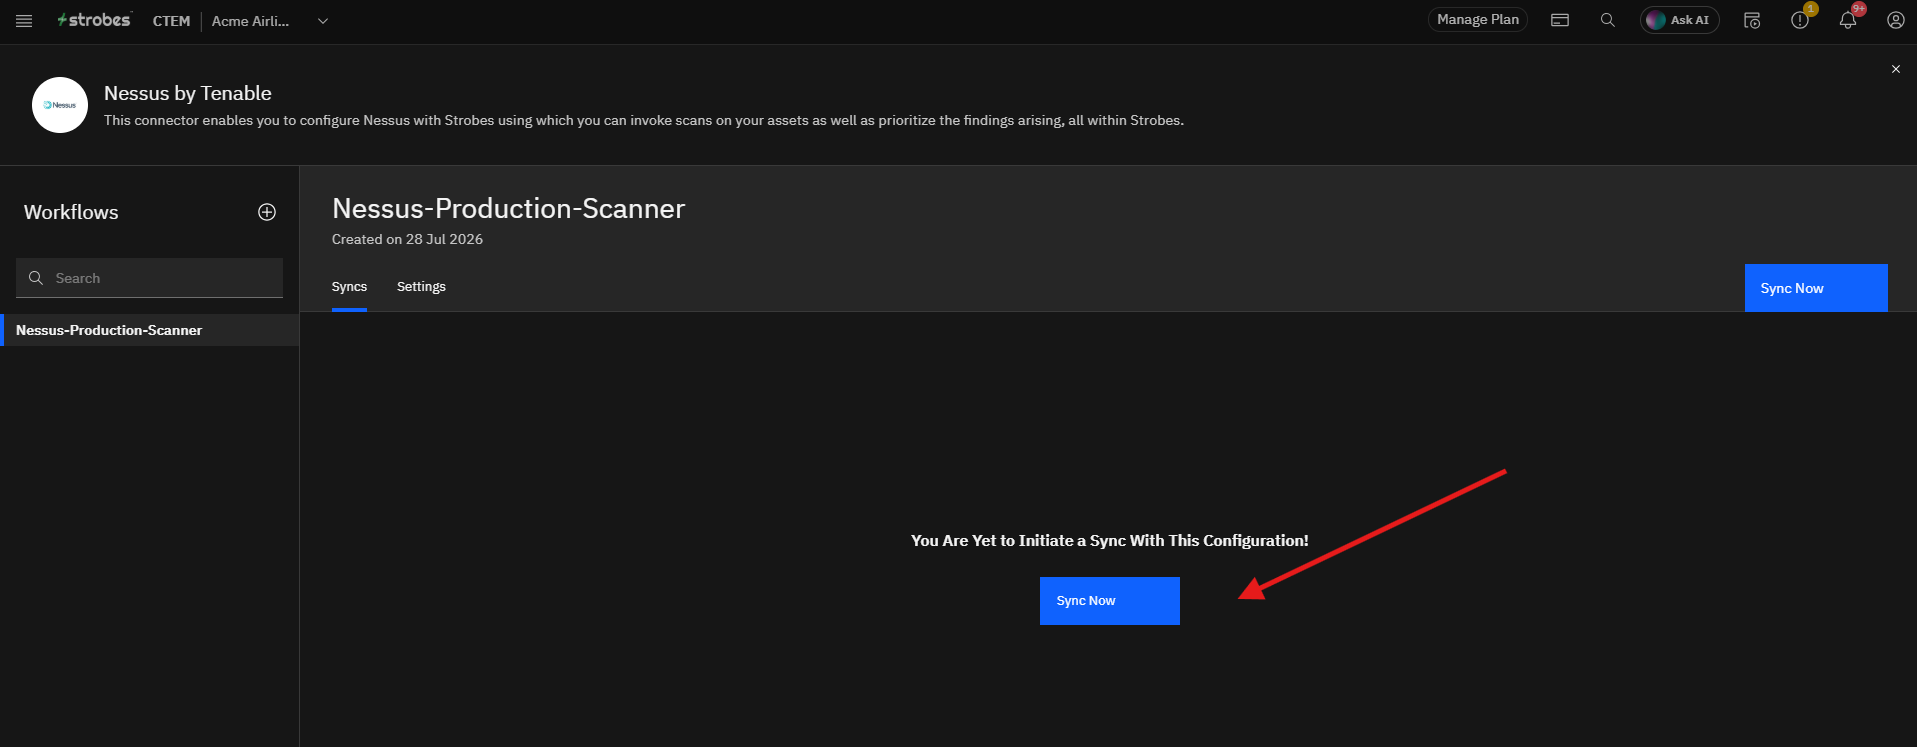
- After submitting, Strobes returns you to the connector's Workflows list, where your new configuration now appears.
- Open the configuration and click Sync Now to pull in your Nessus scan results immediately, or let it run automatically based on the schedule you set in Step 5.
Where Can This Be Used?
Once a sync completes, your Nessus data flows into several places across Strobes:
- Assets: new hosts are added, and existing assets are merged based on the identifiers you chose in Step 4.
- Findings: Nessus findings appear deduplicated against results from any other connected scanners.
- Dashboards: synced findings factor into risk metrics like Overall Risk Score and Mean Time to Remediate.
- Ticketing platforms: if you connected ServiceNow, GitHub, Azure Boards, or Jira in Step 6, findings are pushed there automatically.
Troubleshooting Tips
- Credential couldn't be validated? Double-check the Nessus URL, port (default 8834), username, and password, and confirm Strobes can reach your Nessus instance over the network.
- Scan ID error on submit? The Scan field only accepts a numeric Scan ID (or comma-separated IDs, e.g., 123,124), not free text. Find the correct ID on the scan's details page in your Nessus console.
- No findings after a sync? Confirm the Nessus user account has permission to view the scan(s) referenced, and that the scan has completed at least once in Nessus.
- Findings not appearing in your ticketing tool? Make sure the relevant connector is fully configured and selected in Step 6.
Last updated: 8/7/26, 9:17 AM