
Creating a New Automation
Overview
If none of the built-in templates fit your workflow, you can build an automation from scratch. Strobes gives you two ways to do this: configure it manually by selecting the module, trigger hooks, filters, pipeline, and actions yourself, or describe what you want in plain English and let AI generate the configuration for you.
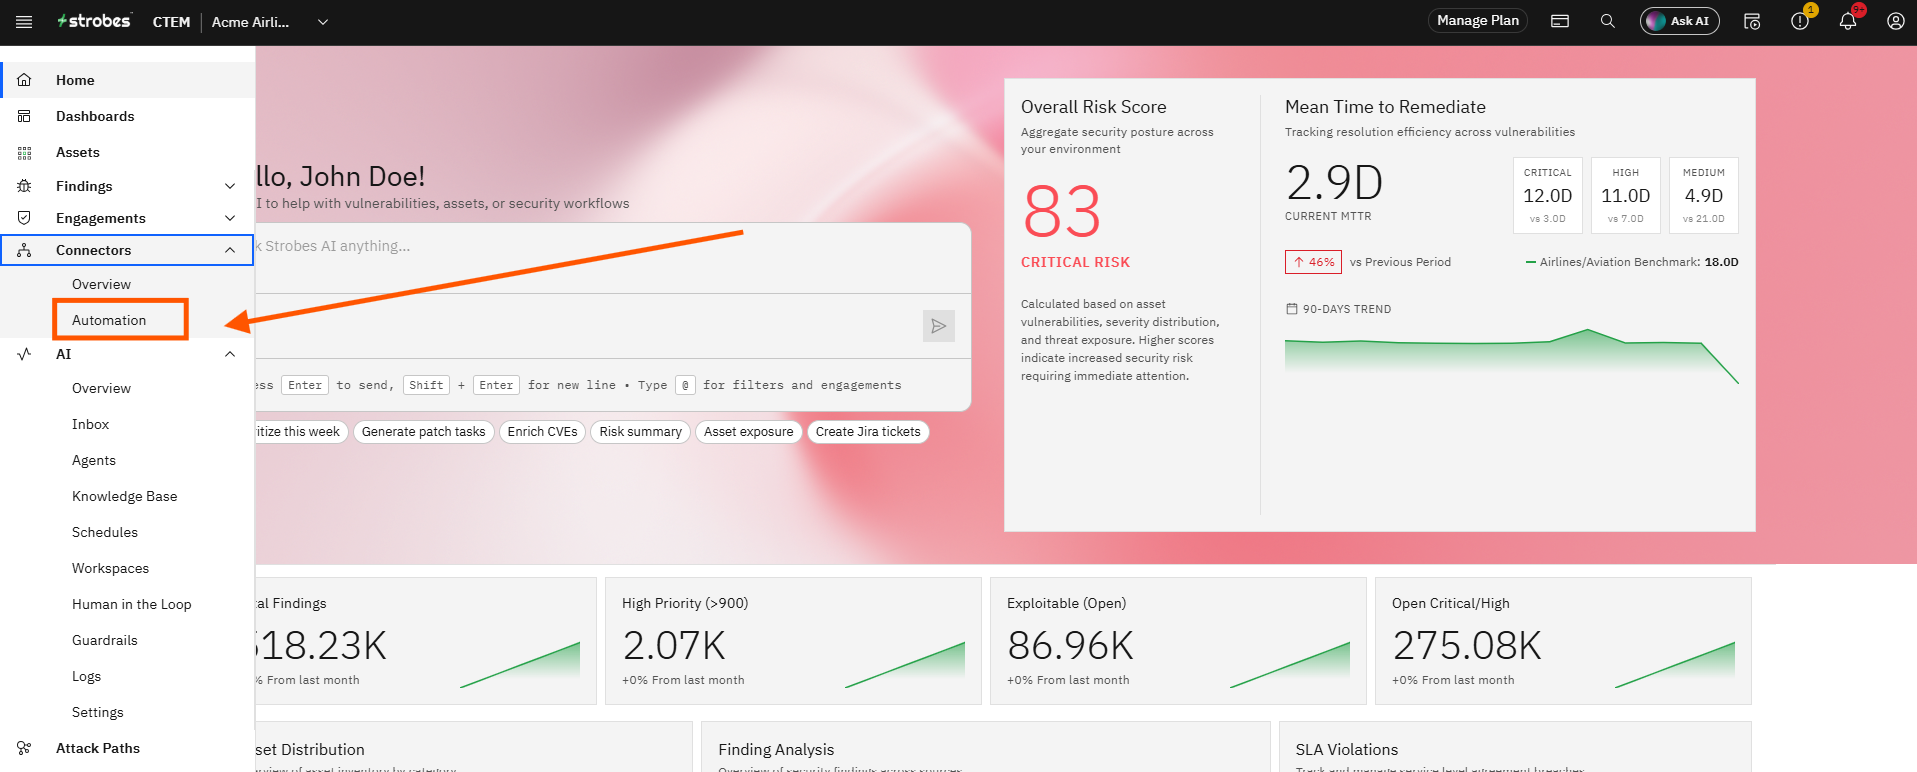
Automations are managed under Connectors in the left sidebar.
Before You Start
- You need Owner or Manager permissions to create automations.
- Know which module you're targeting — Assets, Findings, Engagements, or Logs.
- Have the destination service ready (e.g., Slack webhook URL, JIRA credentials) if your automation sends notifications.
Step 1: Open Automations
- Go to Automations in the left sidebar under Connectors.
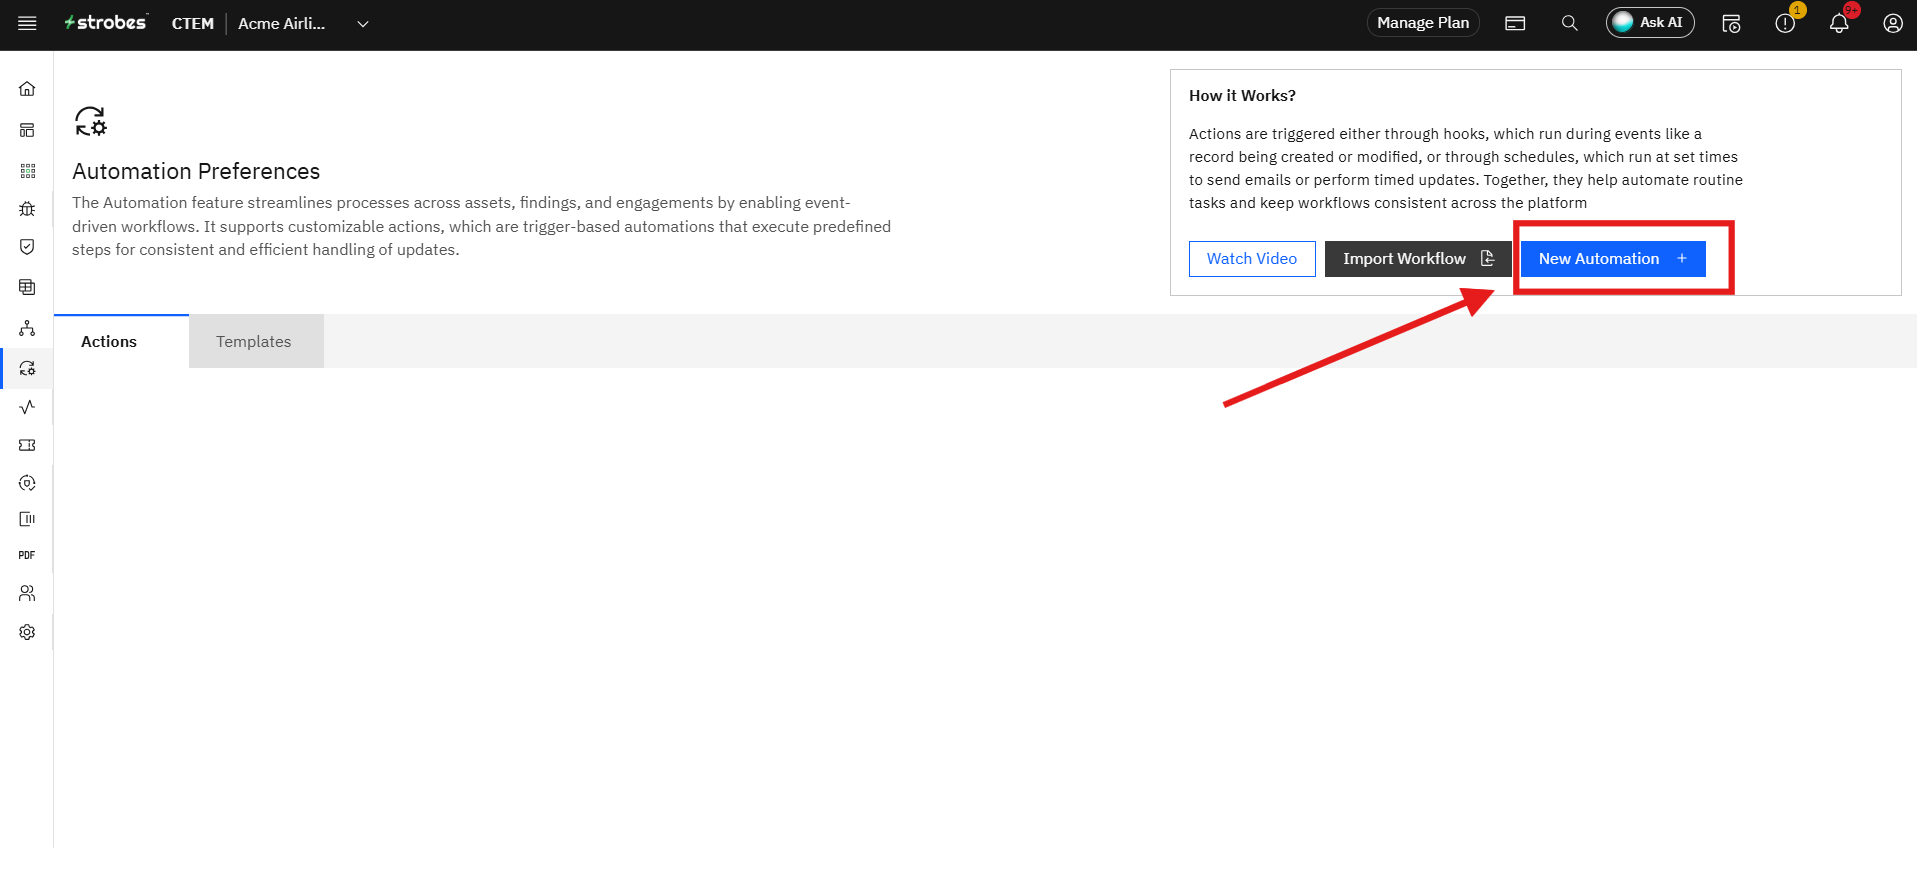
- Click on New Automation.
Step 2: Start a New Automation
Click New Automation in the top-right corner of the page.
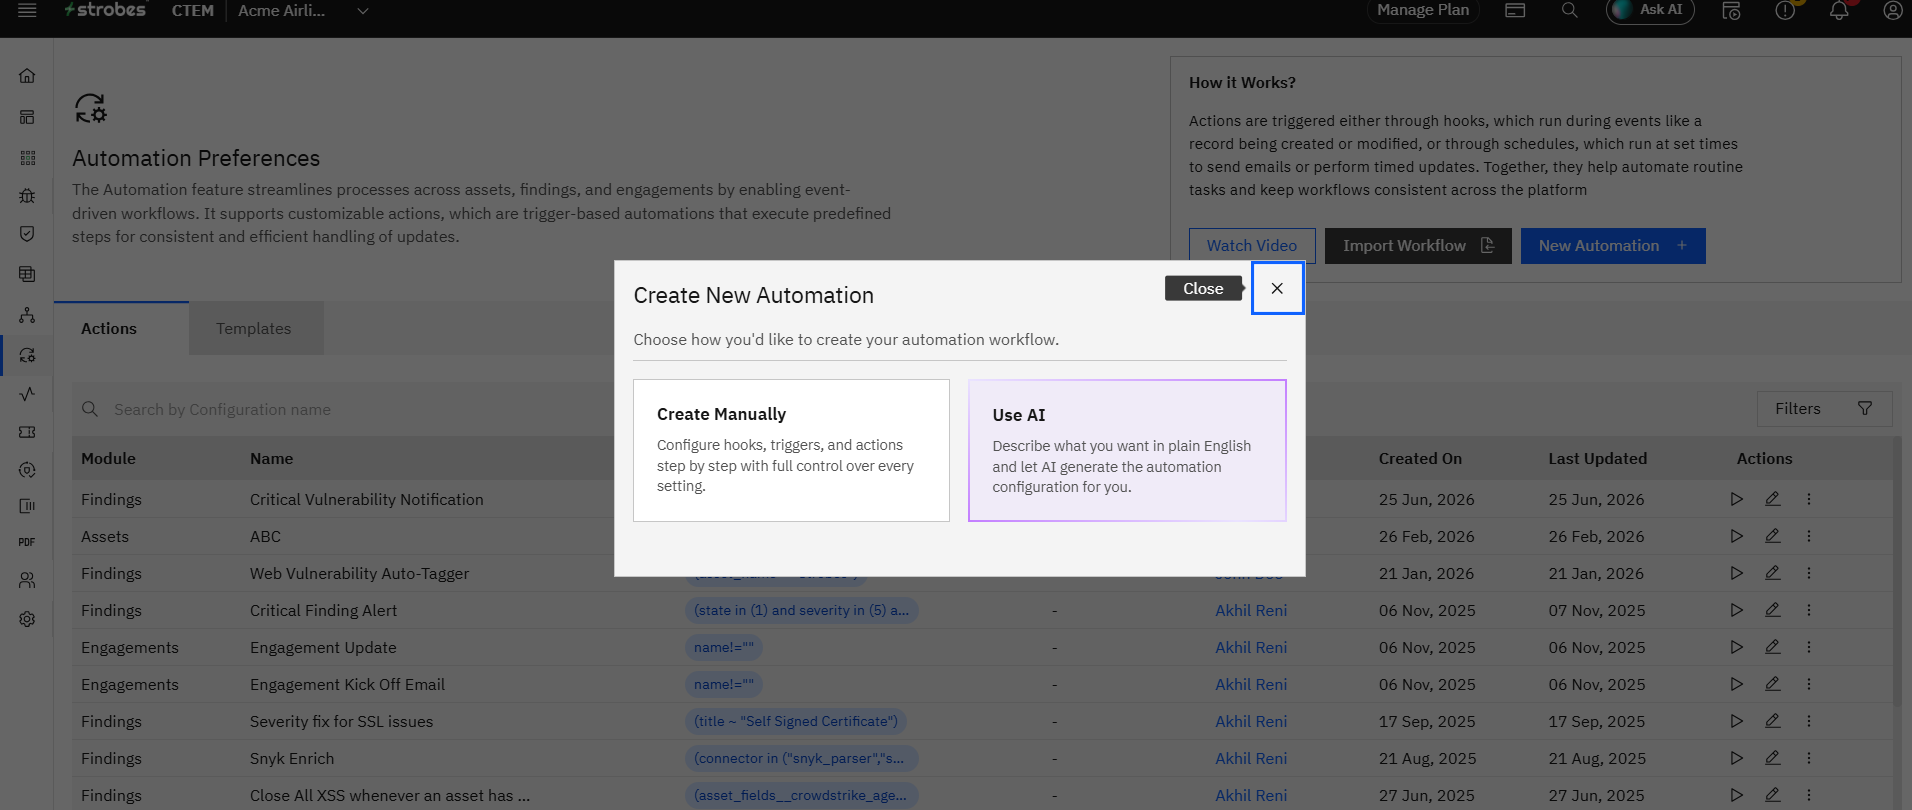
A dialog appears with two creation methods:
Create Manually Configure hooks, triggers, and actions step-by-step with full control over every detail. Use this when you know exactly what trigger events and actions you need.
Use AI Describe what you want in plain English and let AI generate the automation configuration for you. Use this when you have a goal in mind but aren't sure of the exact hook names or filter syntax.
Select your preferred method. Both options open the same 5-step configuration wizard — the difference is that Use AI generates a starting configuration based on your description, which you can then review and adjust.
Step 3: Configuration Details (Step 1/5)
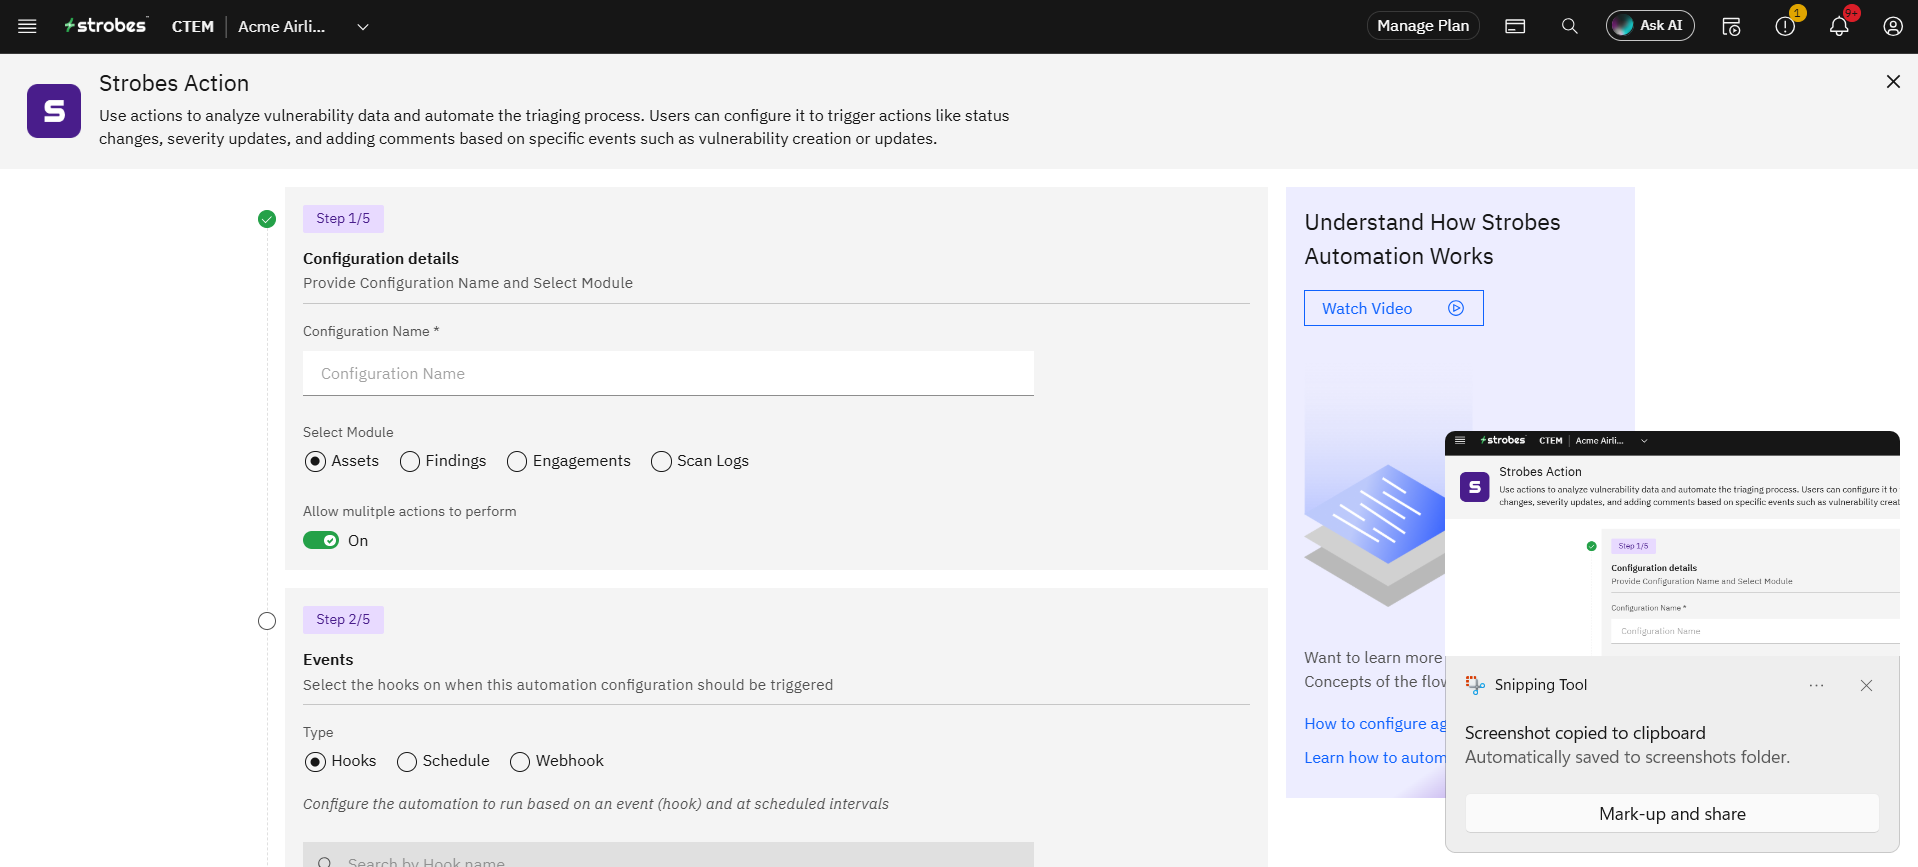
Configuration Name (Mandatory) Give your automation a clear, descriptive name. Example: "High Severity Finding"/ "Slack Alert" or "Close XSS Findings on Asset Removal". This name appears in the Actions table and should be recognizable at a glance.
Select Module Choose which data type this automation monitors:
Module | When to use |
|---|---|
Assets | Trigger on asset creation, updates, or status changes |
Findings | Trigger on vulnerability/finding events (most common) |
Engagements | Trigger on engagement lifecycle events |
Scan Logs | Trigger on scan activity and results |
Allow multiple actions to perform Toggle this On if you want the automation to execute more than one action (e.g., send a Slack message and update a field simultaneously). Leave it Off if a single action is sufficient.
Step 4: Events (Step 2/5)
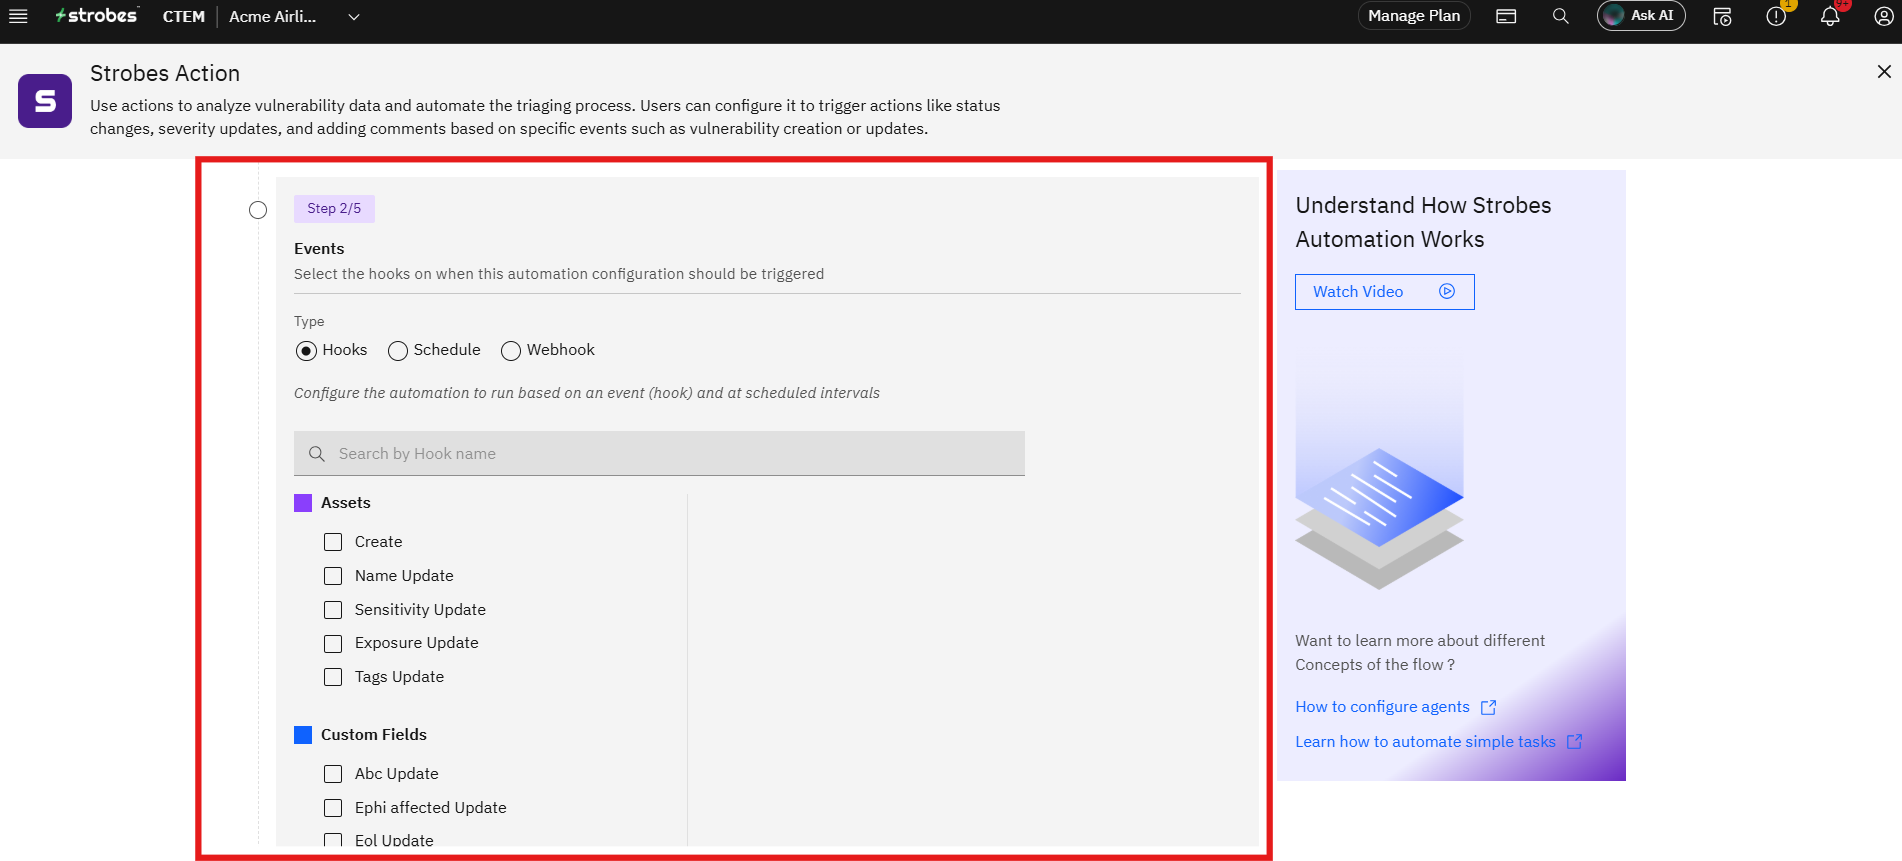
Events control when the automation should trigger. Choose the trigger type:
Hooks
Triggers run when a specific data event occurs in the platform (a record is created, a field is updated, etc.).
Use the Search by Hook name field to find hooks. Hooks are grouped by entity type:
Findings hooks - These are Default fieds
Custom Fields hooks - There are for the custom fields that are created.
Click a hook to select it. Selected hooks appear as tags next to the search field. You can select multiple hooks — the automation runs when any of the selected hooks trigger.
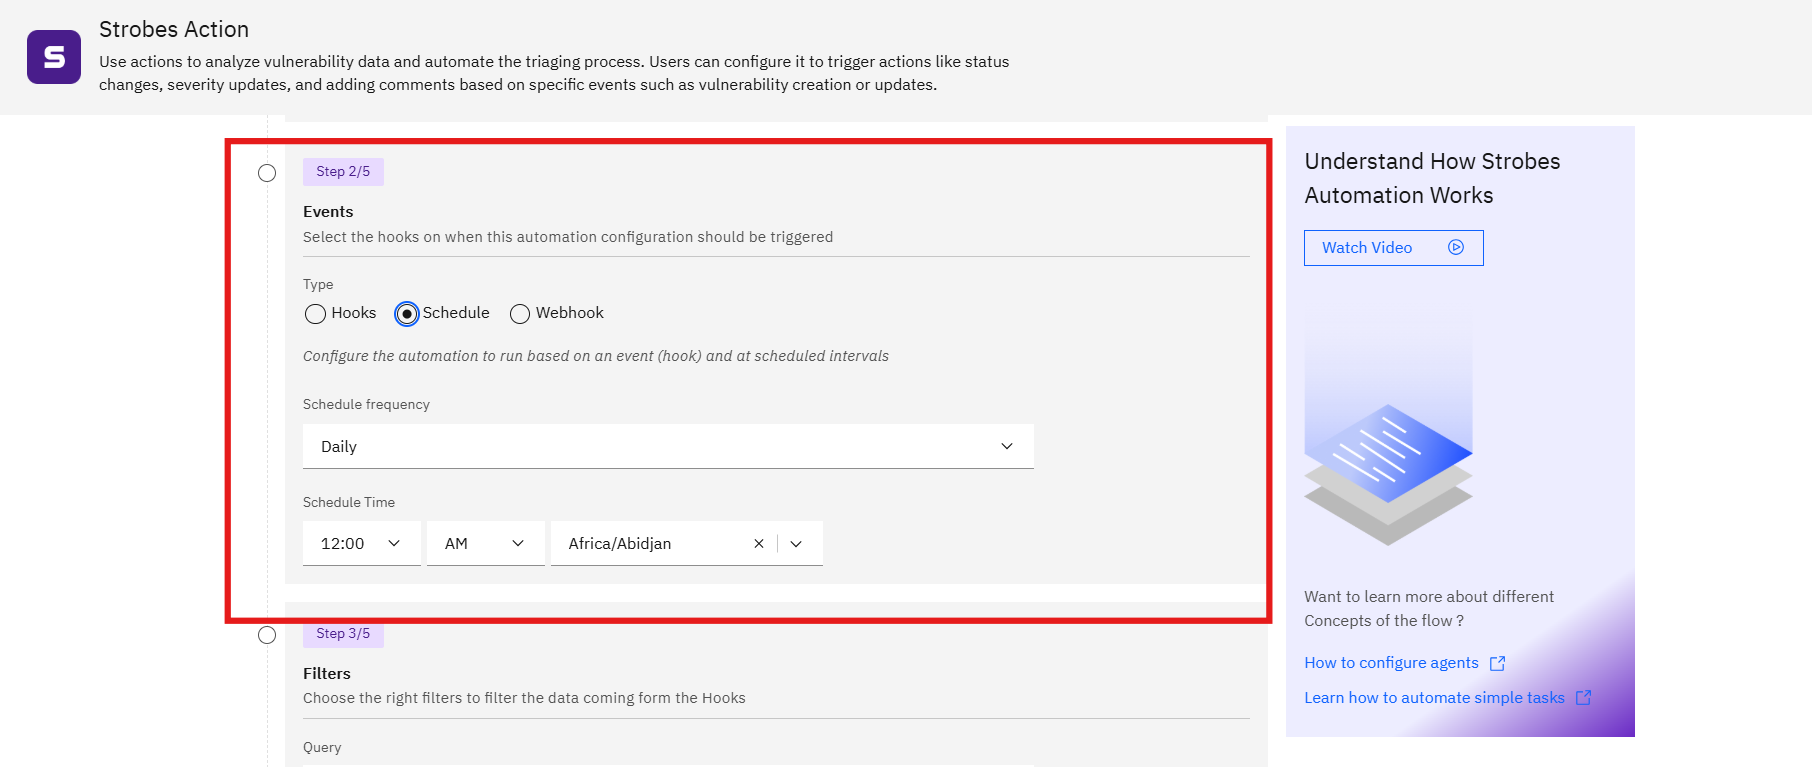
Schedule
Triggers the automation at a set time interval (e.g., daily, weekly). Use this for periodic tasks like compliance report generation or SLA deadline summaries.
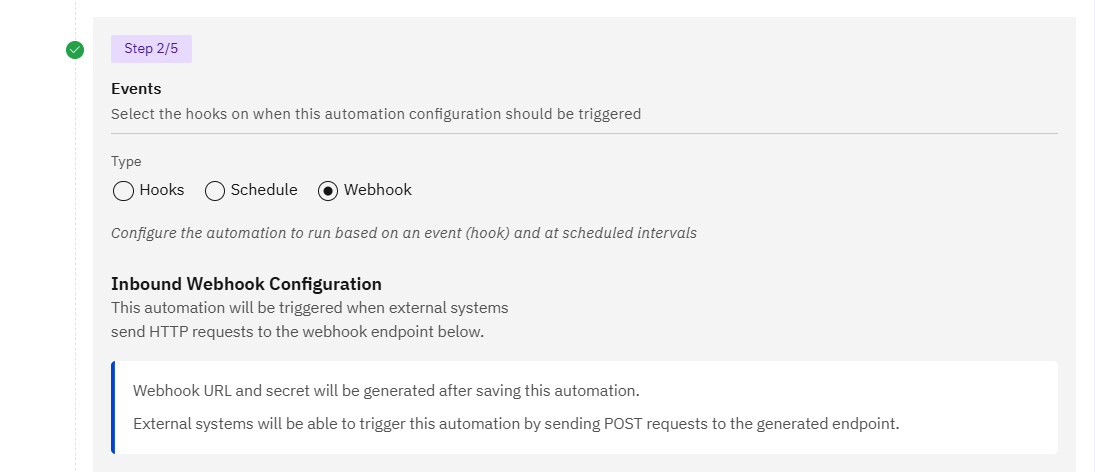
Webhook
Triggers the automation when an external system calls a specific webhook endpoint. Use this for integrations where a third-party tool initiates the workflow.
Step 5: Filters (Step 3/5)
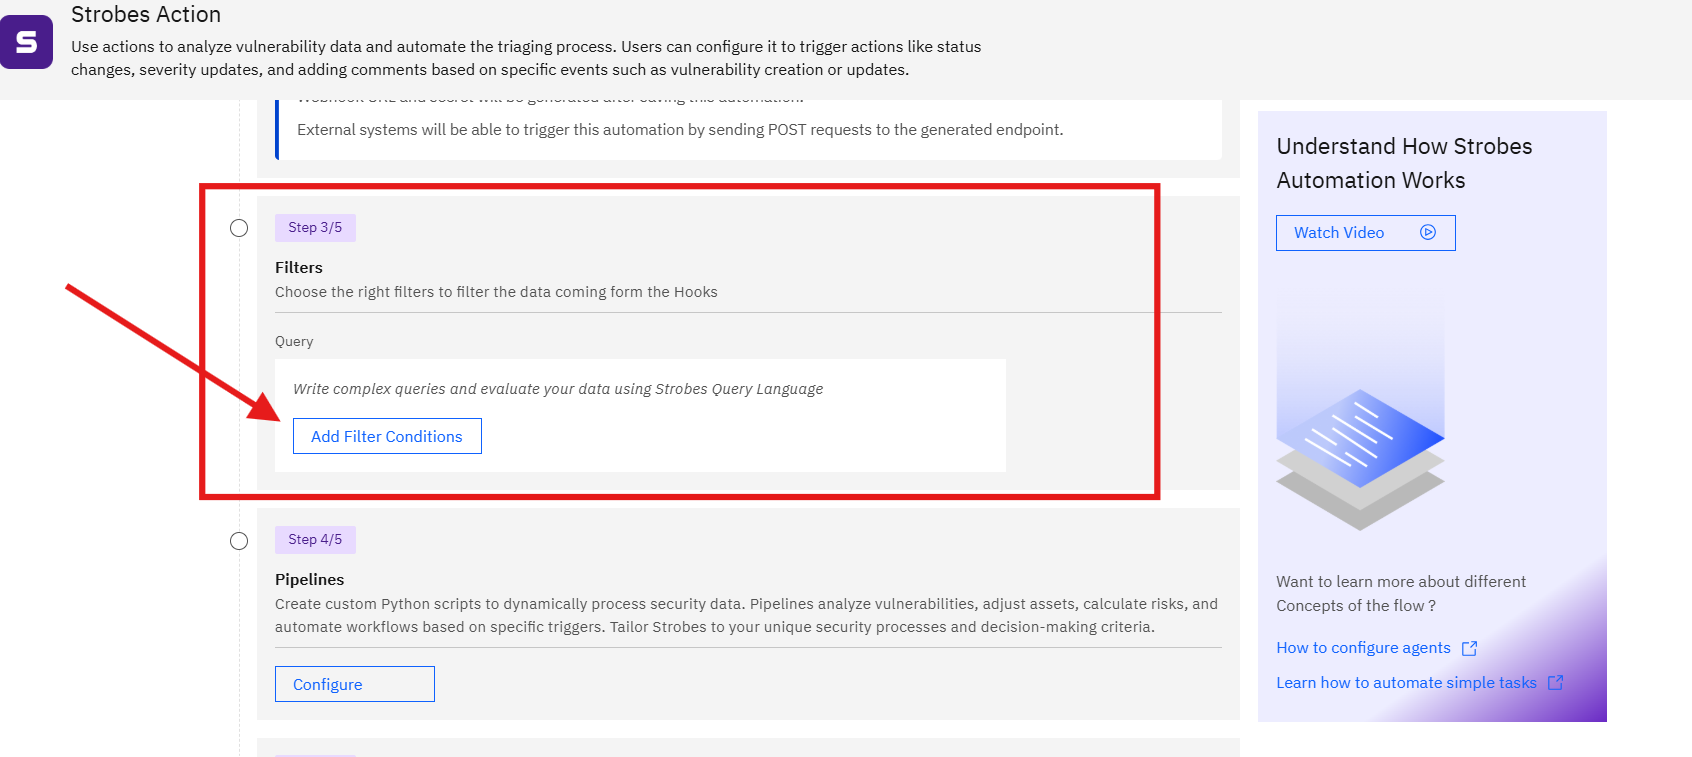
Filters narrow which records the automation acts on. Without a filter, the automation fires for every event matching your selected hooks across all findings (or assets/engagements).
Enter a filter expression in the Query field using field comparisons:
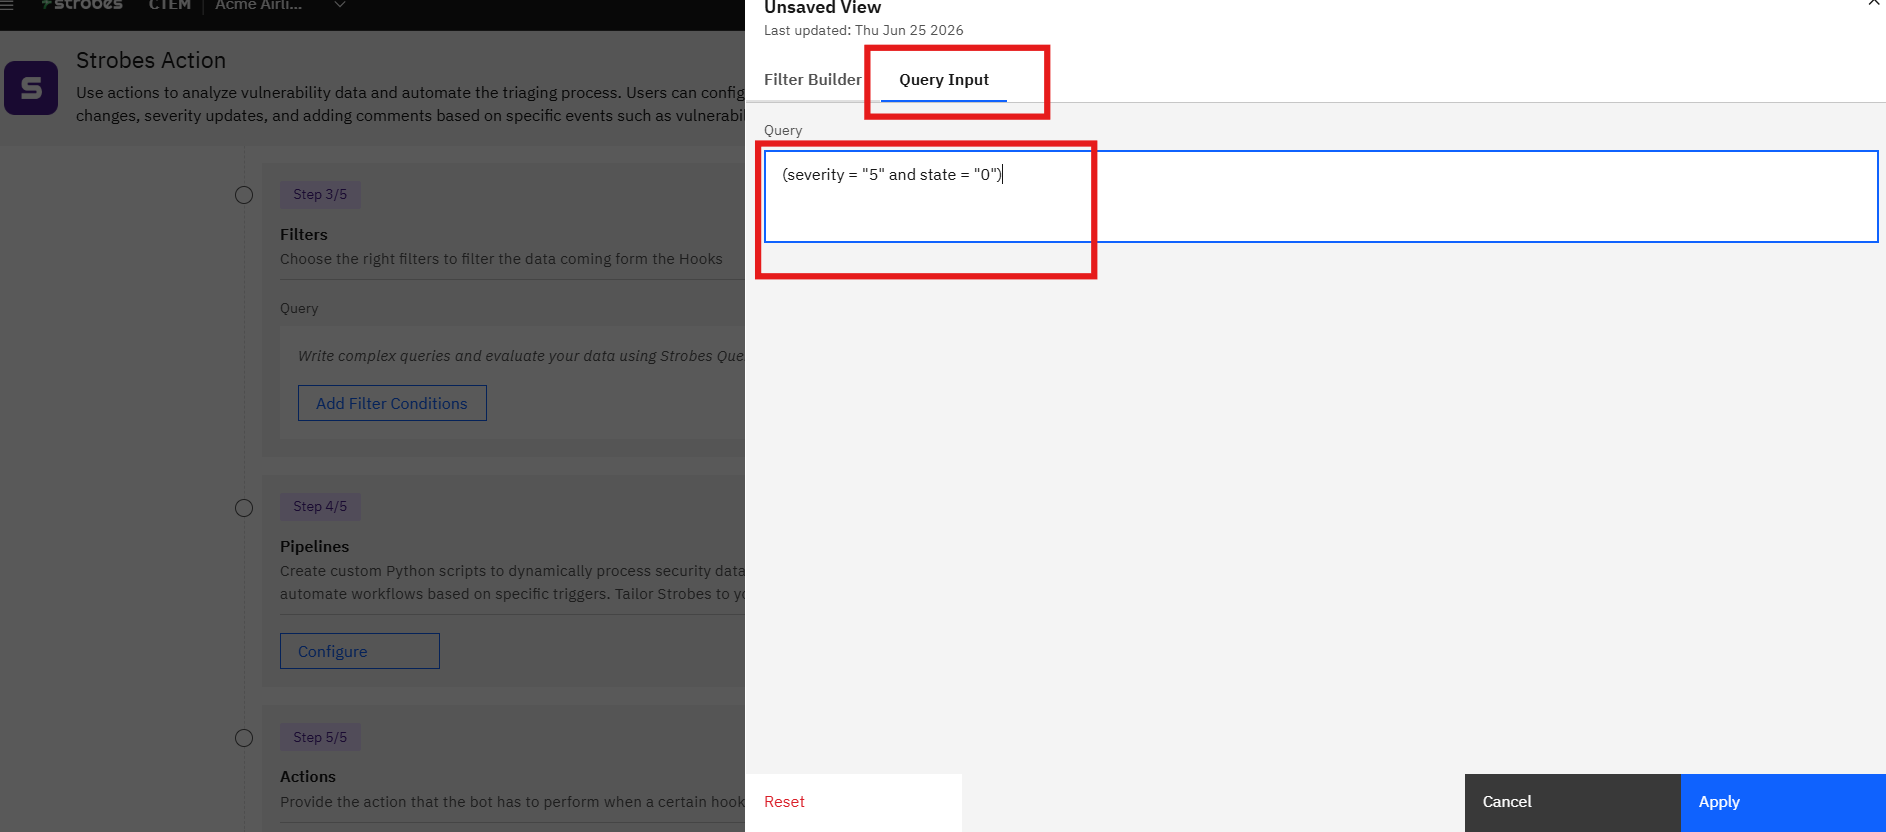
severity = 5 and state = 0This example restricts the automation to Critical (severity 5) findings that are currently open (state 0).
Other examples:
severity >= 4asset_type = "web" and severity = 5Leave the query field blank to apply the automation to all records that match the selected hooks.
Step 6: Pipelines (Step 4/5)
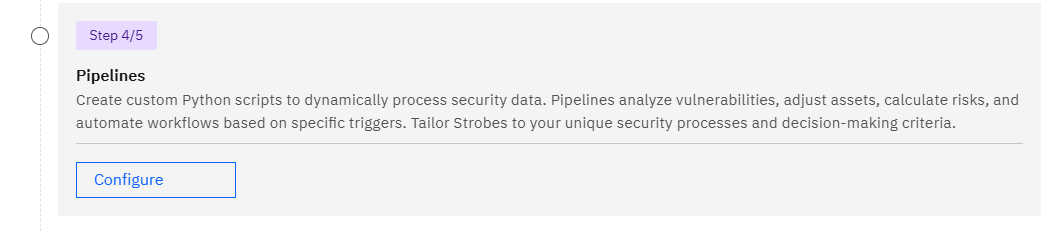
Pipelines are optional custom Python scripts that run between the trigger event and the action. Use them when you need to:
- Transform or enrich the data before an action runs
- Apply conditional logic that's too complex for the filter query
- Calculate a custom risk score or derive a value from multiple fields
- Call an external API as part of the workflow
Click Configure to open the pipeline editor and write your script.
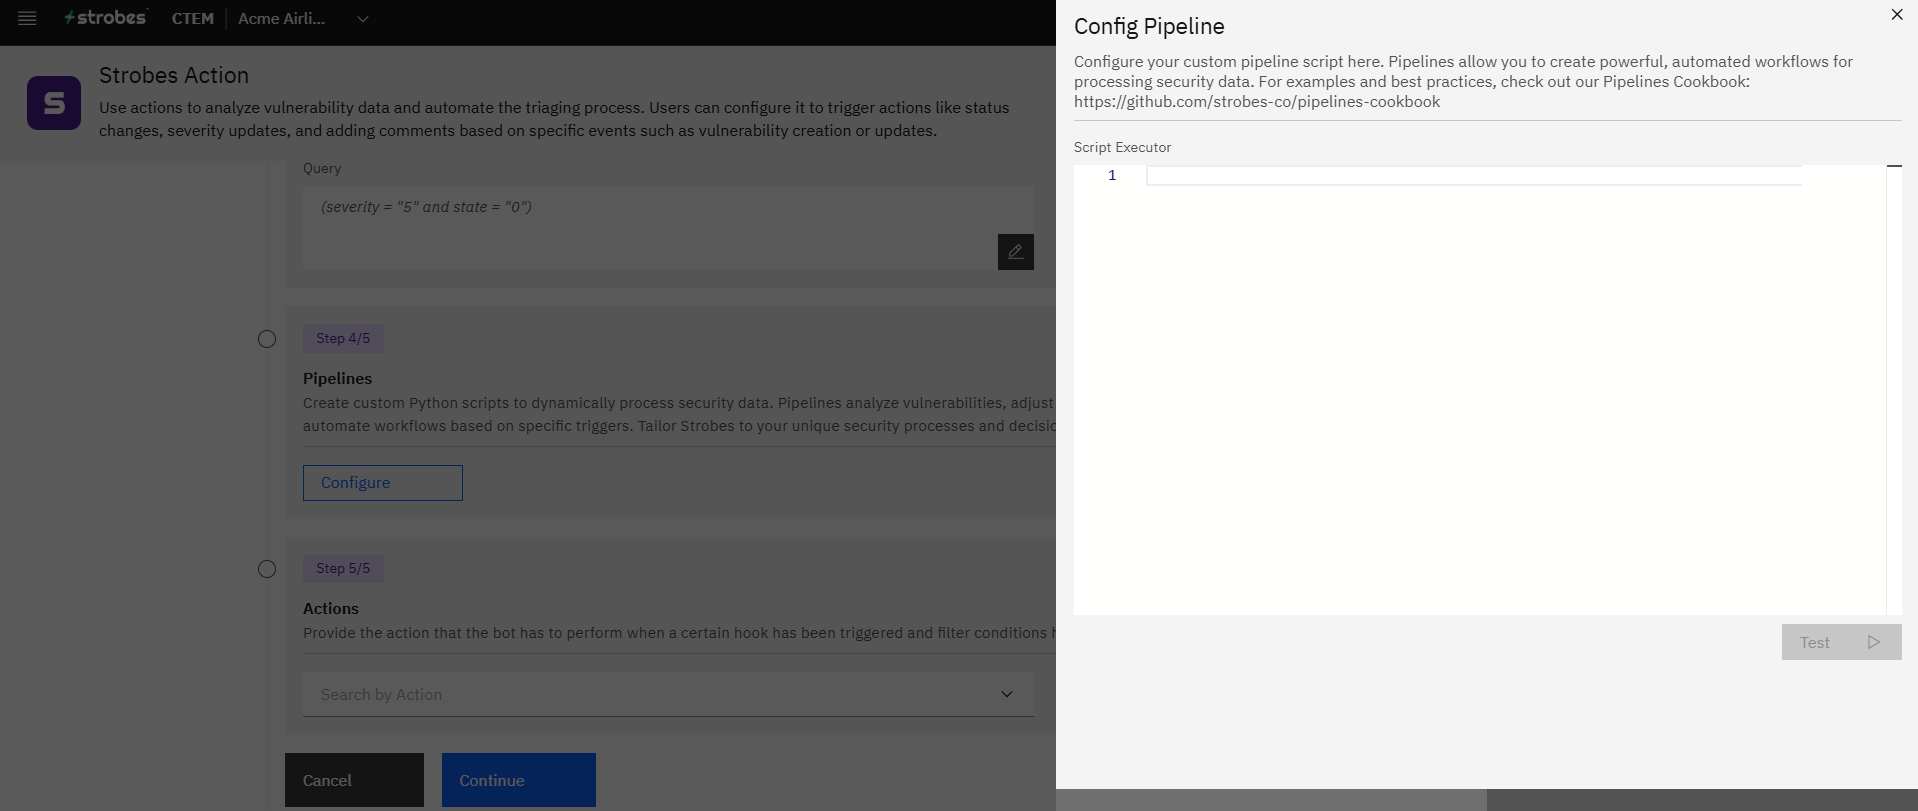
If you don't need custom processing, skip this step as most automations work fine without a pipeline and Continue.
Step 7: Actions (Step 5/5)
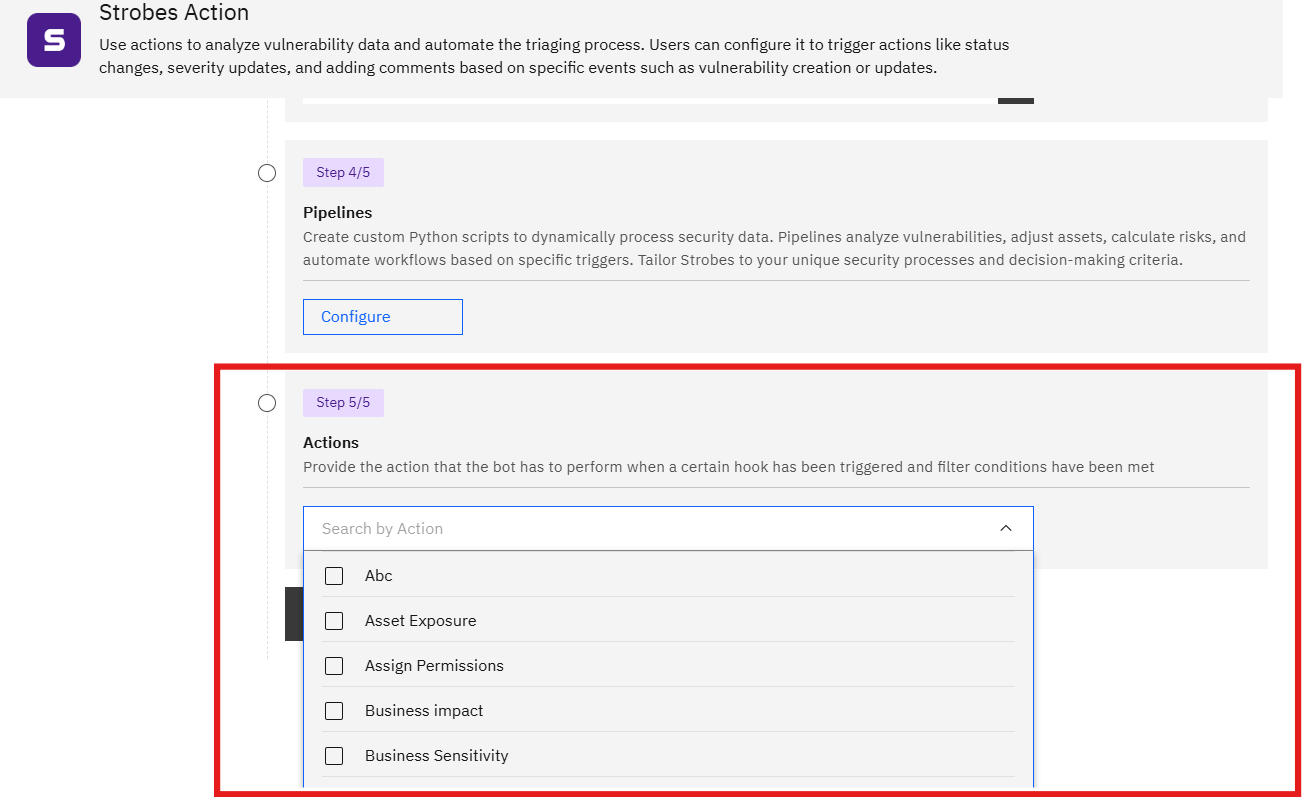
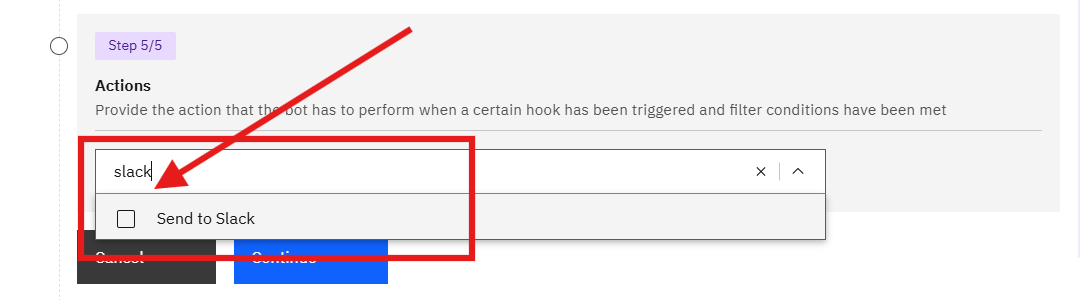
Actions define what the automation does when triggered. Use the Search by Action field to find and add actions. You can add more than one — each selected action appears as a numbered card with an expand arrow to configure its settings.
Available action types include: Send to Slack, Accepted Risk Date, Affected Hosts, Analysis, Assigned To, CVE, CWE, Description, Escalation, External Dependencies, False Positive Signals, and more.
Setting Up a Slack Notification Action
- Search for and select Send to Slack.
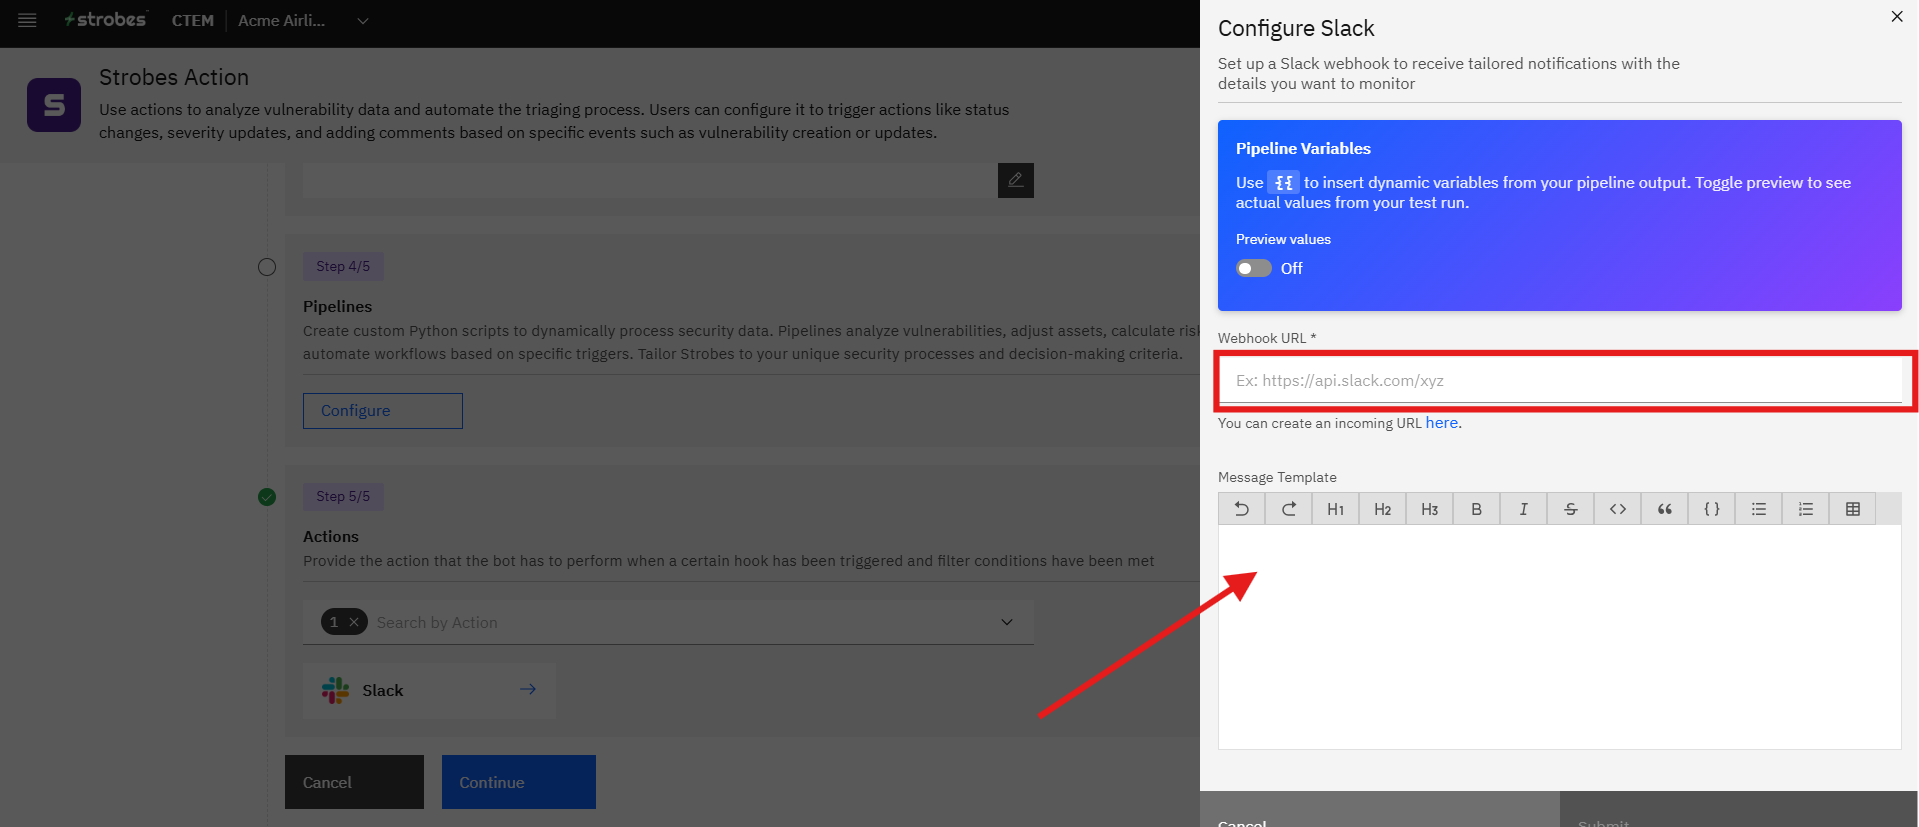
- The Configure Slack panel opens on the right side of the screen.
- Fill in the fields:
- Webhook URL (required) — paste your Slack incoming webhook URL. Click the here link to create one in Slack if you haven't already.
- Pipeline Variables — if you've set up a pipeline in Step 4/5, toggle Preview Values on to see how dynamic variables will render using real data.
- Message Template — write the message body. Use
{{to insert dynamic fields from your pipeline output. Example:Critical vulnerability detected: {{title}} with severity {{severity}}. Please review immediately.
- Click Submit to save the Slack action configuration.
Validation
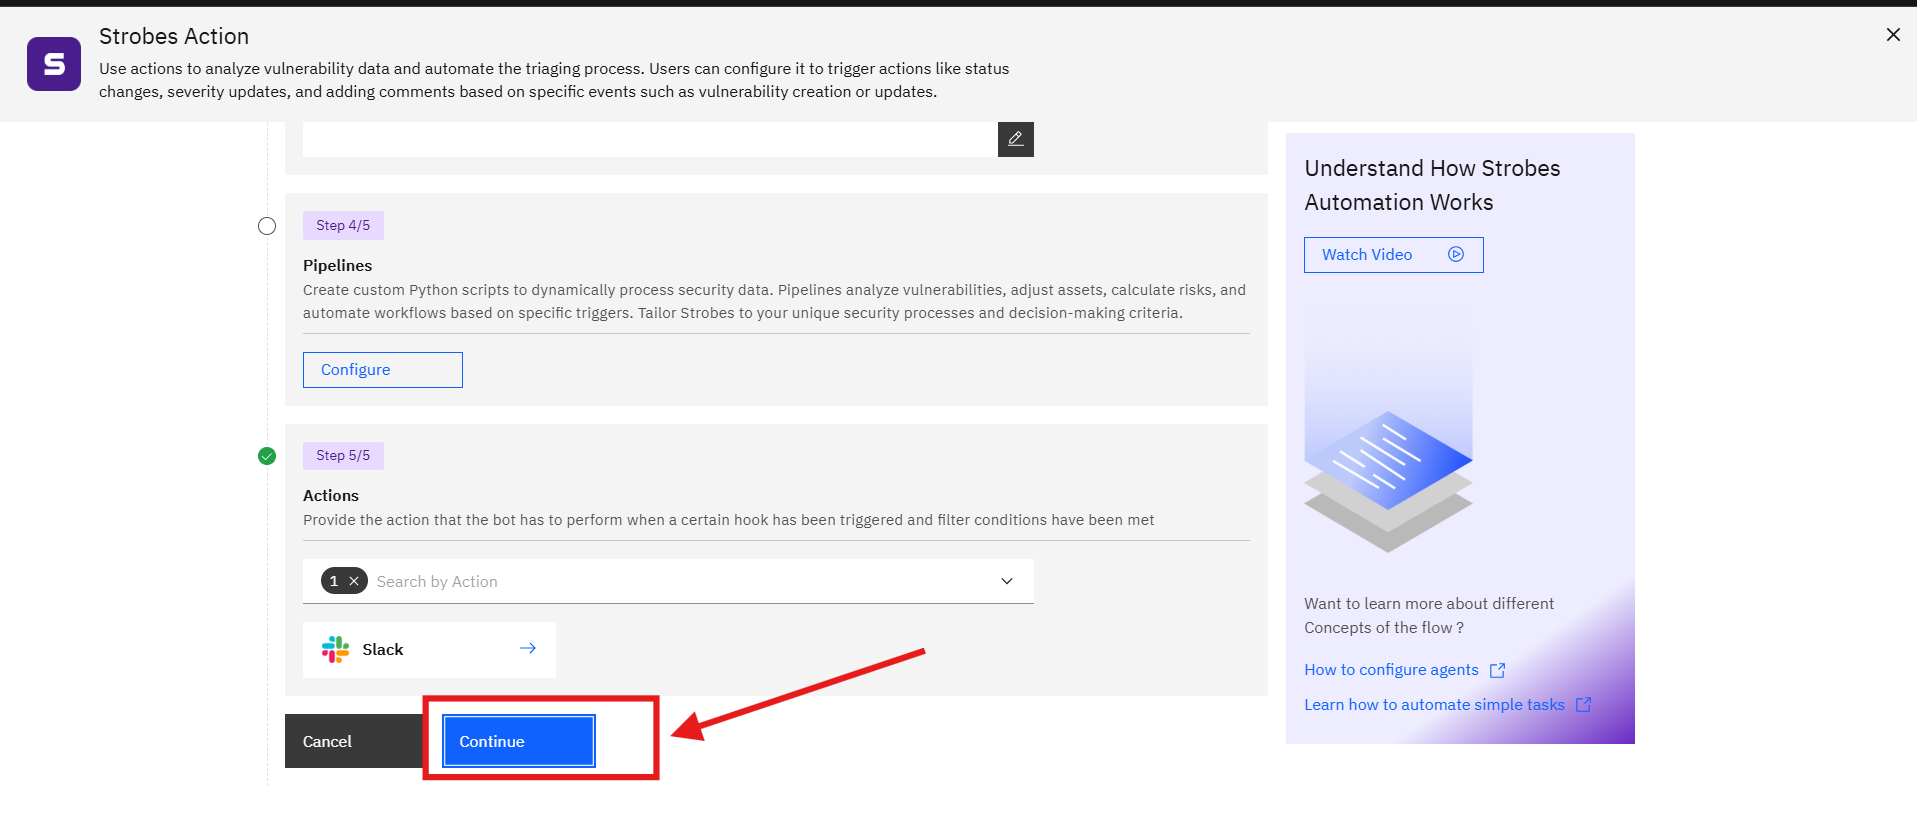
The Continue button stays inactive until all required action fields are filled. If you see error banners:
- Actions Required: Please select at least one action — you haven't selected any action yet. Use the Search by Action field to add one.
- Actions Data is Required: Please fill out the required fields — an action card has unfilled mandatory fields. Expand the card and complete all required inputs (e.g., Webhook URL for Slack, date for Accepted Risk Date).
Once all fields are valid, click Continue.
Step 8 — Automation Created
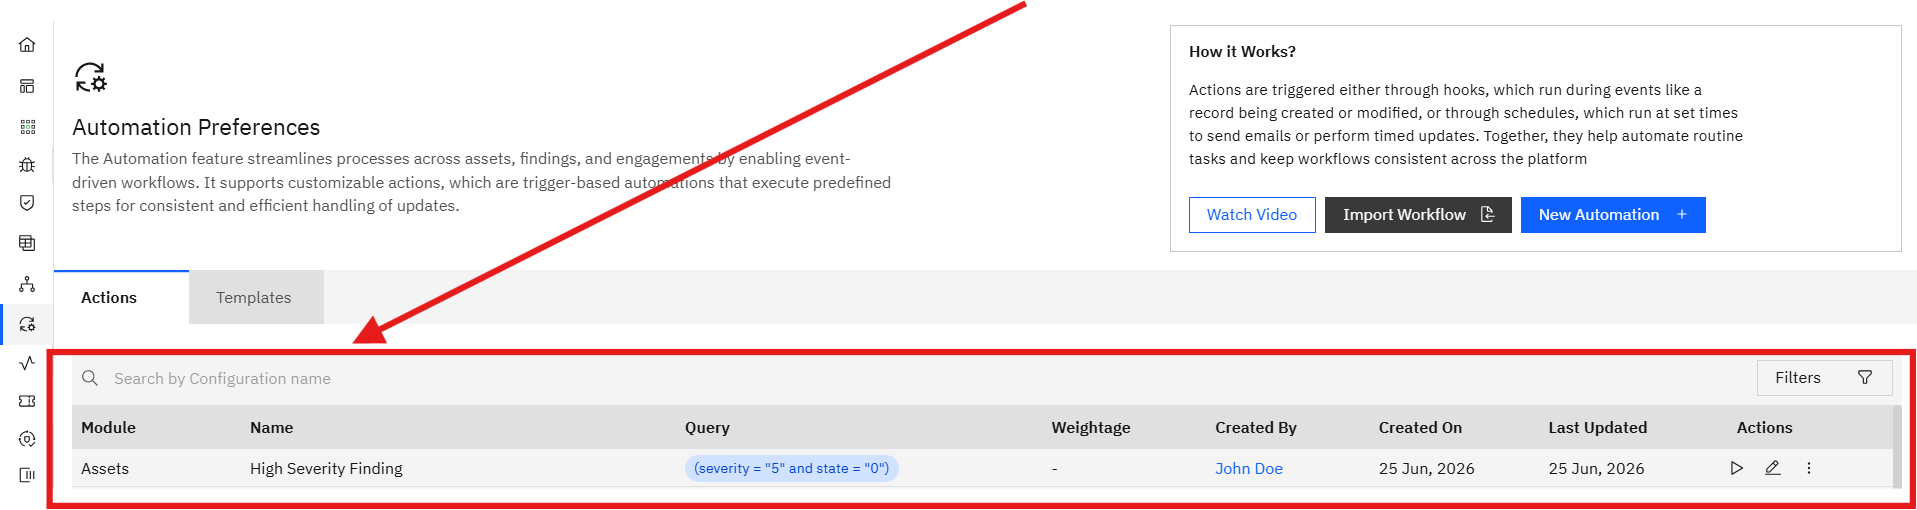
Strobes processes the submission ("Creating… Please wait while we create the action…") and returns you to the Actions tab with a green Action Created Successfully! notification. Your automation appears immediately in the table and is active.
Tips
Name automations so they're self-describing. Include the trigger event, the module, and the output action in the name — for example, "Findings — Critical Created — Slack Alert". This makes the Actions table easy to scan when you have many automations.
Start narrow with your filter. A broad filter (no query) can trigger an automation hundreds of times during an import or bulk update. Add a specific filter query and test it against a small data set before going wide.
Use AI creation for a starting point, not a final config. The AI option generates a reasonable starting configuration, but review each step carefully. Confirm the hooks, filter syntax, and action settings are correct before saving — AI-generated queries may need refinement for your specific data model.
Multiple actions run in sequence. If you add more than one action (toggle "Allow multiple actions" on in Step 1), they execute in the order they were added. If one action fails (e.g., Slack webhook is unreachable), subsequent actions may not run. Check the Automation run logs if a multi-action automation behaves unexpectedly.
Editing an existing automation. From the Actions tab, click the edit icon on any row to reopen the configuration wizard and modify any step. Changes take effect immediately on save.